CedrusDB design system
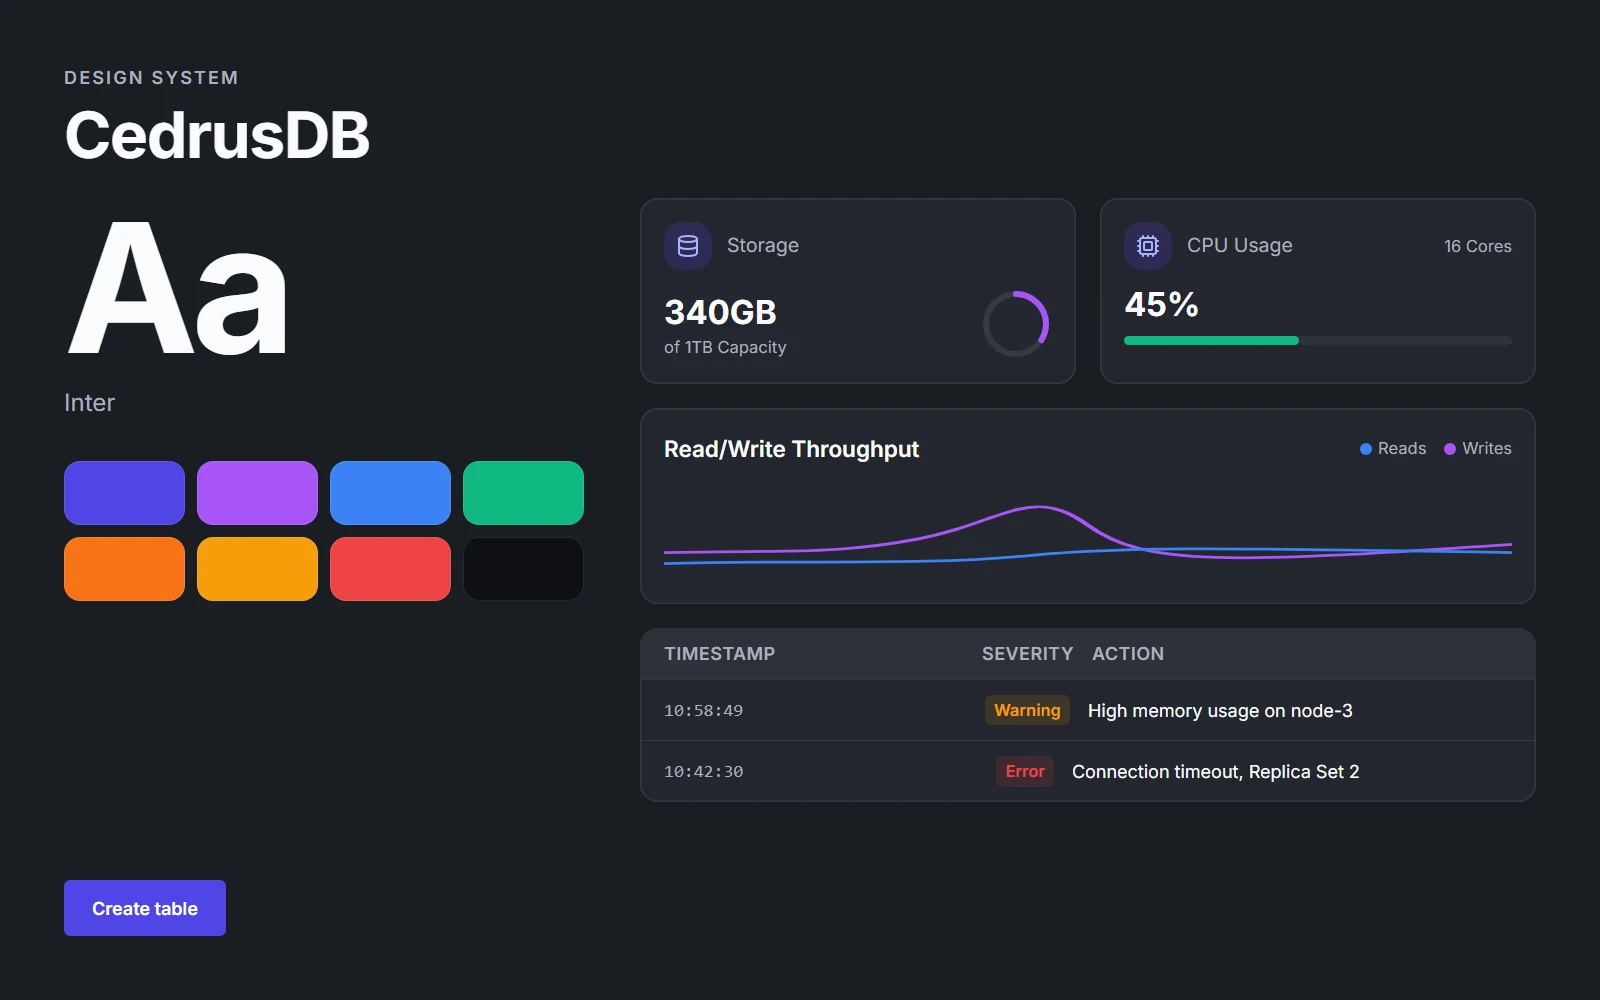
The UI kit behind the CedrusDB database console: indigo actions, data-series colours for charts, KPI and log cards, a monospaced code style, in dark and light.
- Role
- UX/UI designer
- Year
- 2025
Overview
CedrusDB's system is made for dense technical data and long sessions. Graphite and gray surfaces stay out of the way, indigo marks every action, and each metric has a fixed chart colour across all pages.
Everything on this page is rebuilt in code from the original CedrusDB screens: the colours and font sizes were taken from the exported Figma files.
Colour
Brand and data
Indigo
#4F46E5
Primary actions, active tab
Violet
#A855F7
Write throughput, storage ring
Blue
#3B82F6
Read throughput, info logs
Emerald
#10B981
Memory, healthy, completed
Orange
#F97316
CPU series
Amber
#F59E0B
Warnings
Red
#EF4444
Errors, danger zone
Surfaces and text
Top bar
#0F1115
Navigation bar in dark
Graphite
#1A1D24
Page background in dark
Panel
#23272F
Cards in dark
Line dark
#343A46
Borders in dark
Gray 100
#F3F4F6
Page background in light
Gray 900
#111827
Text in light
Gray 500
#6B7280
Secondary text
Typography
Typeface
Inter
- Page title
24px · BoldCluster Overview
- KPI
20px · Bold340GB
- Card title
18px · SemiBoldRead/Write Throughput
- Tab
16px · MediumMembers 8
- Code
15px · RegularSELECT o.id, u.email FROM public.orders
- Body
14px · RegularReal-time metrics for Production-US-East cluster
- Table
13px · Regularsarah.chen@acme.io
- Caption
12px · MediumTimestamp
Buttons
Light theme
Primary, secondary and text
States
Dark theme
Primary, secondary and text
States
Inputs and controls
Light theme
Search
Text field
Cluster name
Focused
Select
Range
Segmented control
Chips, toggle and selection
Dark theme
Search
Text field
Cluster name
Focused
Select
Range
Segmented control
Chips, toggle and selection
Cards
Light theme
Storage
340GB
of 1TB Capacity
CPU Usage
16 Cores45%
Read/Write Throughput
ReadsWrites
Dark theme
Storage
340GB
of 1TB Capacity
CPU Usage
16 Cores45%
Read/Write Throughput
ReadsWrites
Icons
Light theme
- Latency
- CPU
- Storage
- Connections
- Tables
- Queries
- Users
- Backups
- Monitoring
- Refresh
- Copy
- Alerts
Outline icons, 1.5–2px stroke on a 24px grid, set in a soft tinted well when they label a row or action.
Dark theme
- Latency
- CPU
- Storage
- Connections
- Tables
- Queries
- Users
- Backups
- Monitoring
- Refresh
- Copy
- Alerts
Outline icons, 1.5–2px stroke on a 24px grid, set in a soft tinted well when they label a row or action.
Radius, spacing and badges
Corner radius
- Badge 4px
- Input 6px
- Button 6px
- Card 12px
Spacing scale
- 4px
- 8px
- 12px
- 16px
- 24px
- 32px
Badges and status