CedrusDB
A database cloud console for monitoring clusters, browsing tables, running SQL, managing access and restoring backups, in matching dark and light themes.
- Role
- UX/UI designer
- Year
- 2025
The project
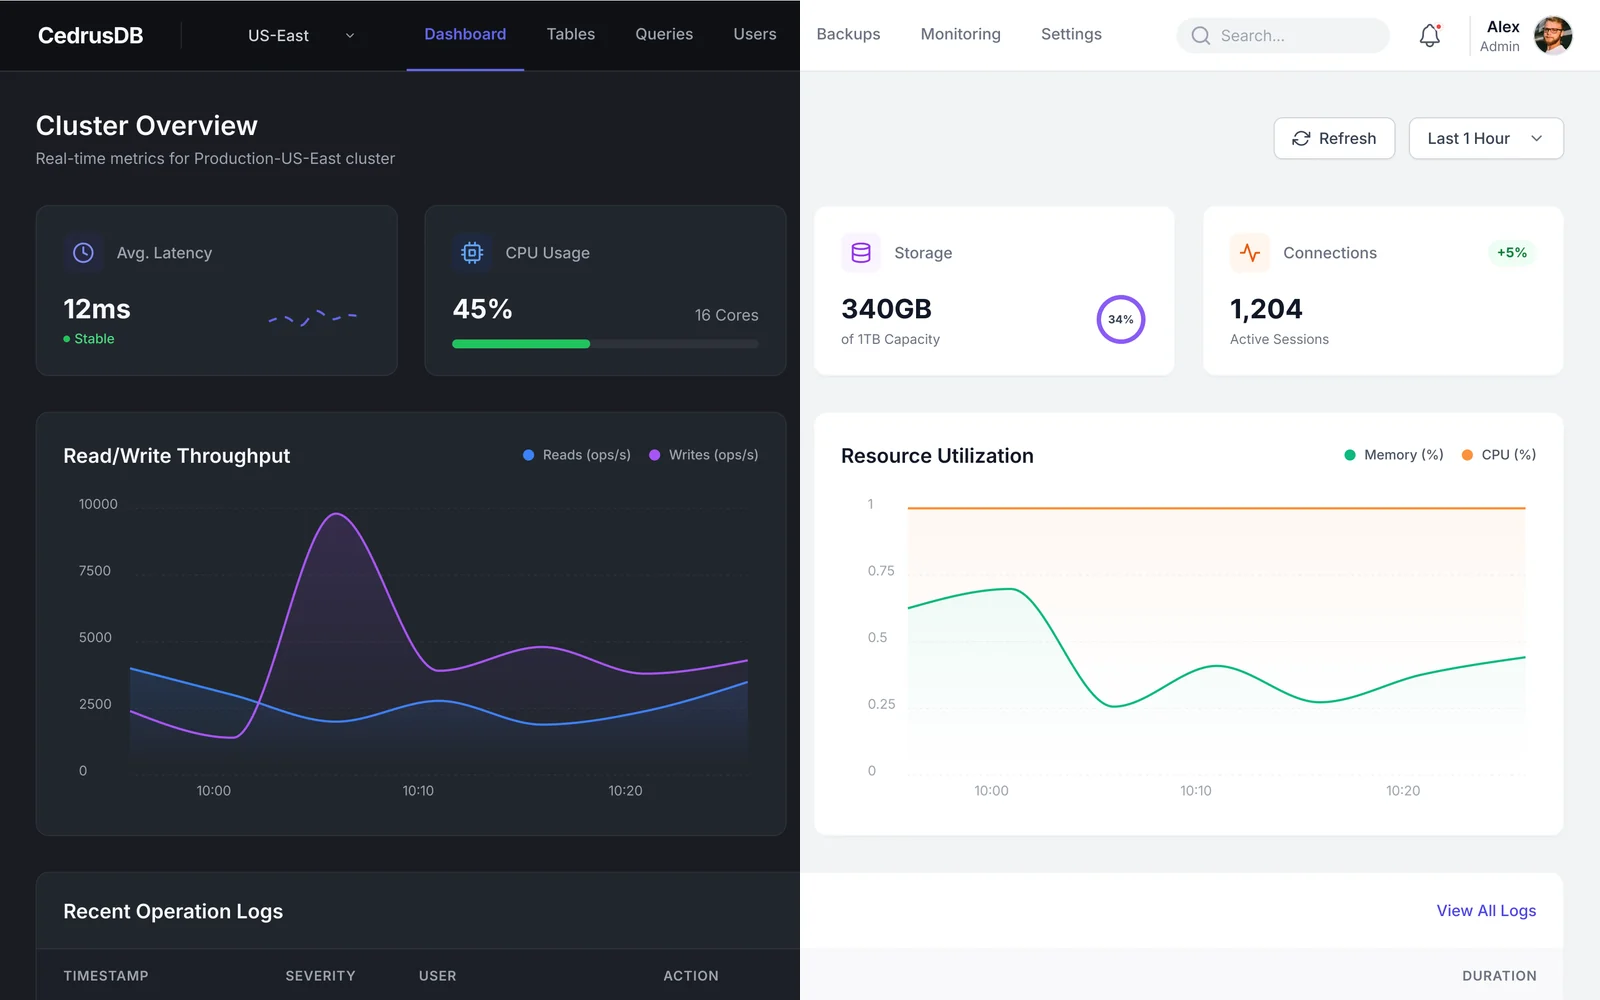
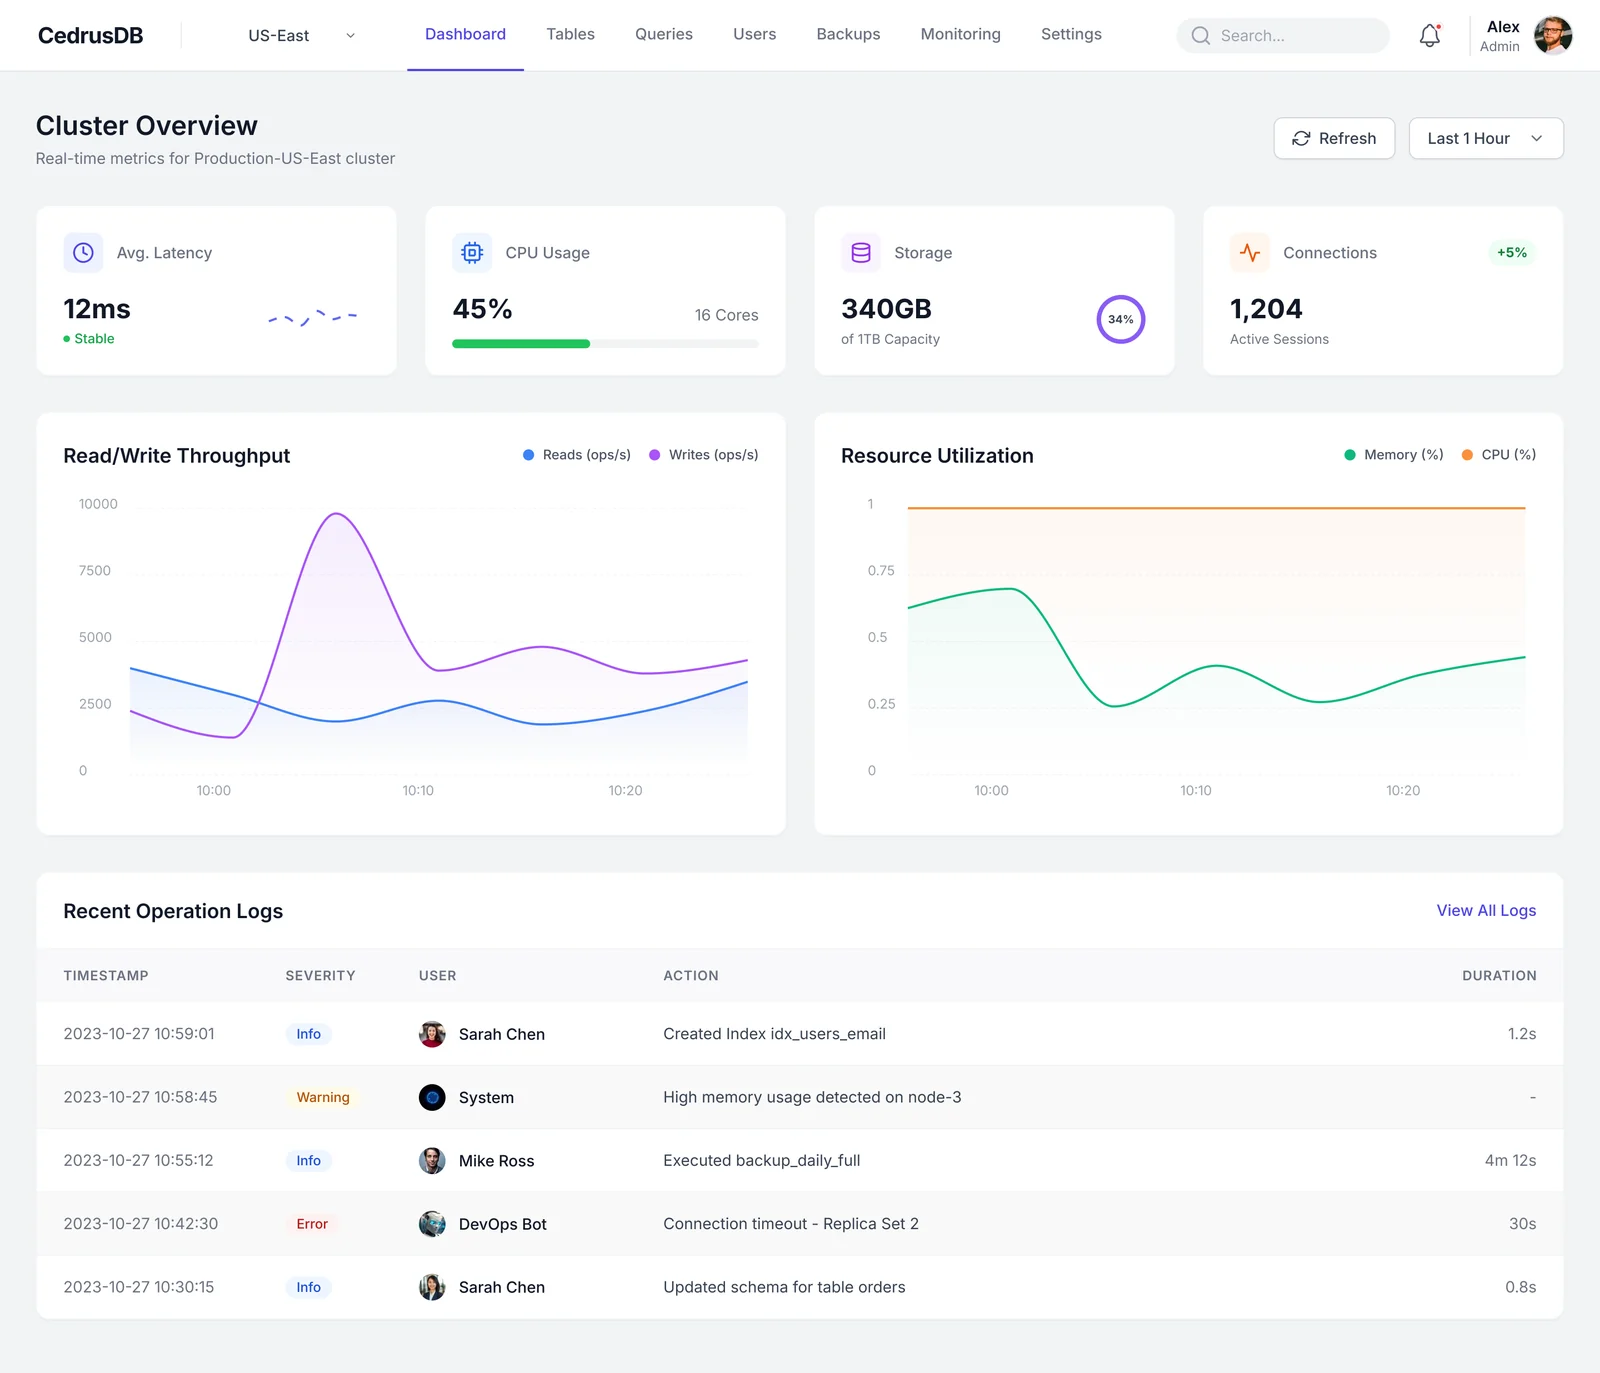
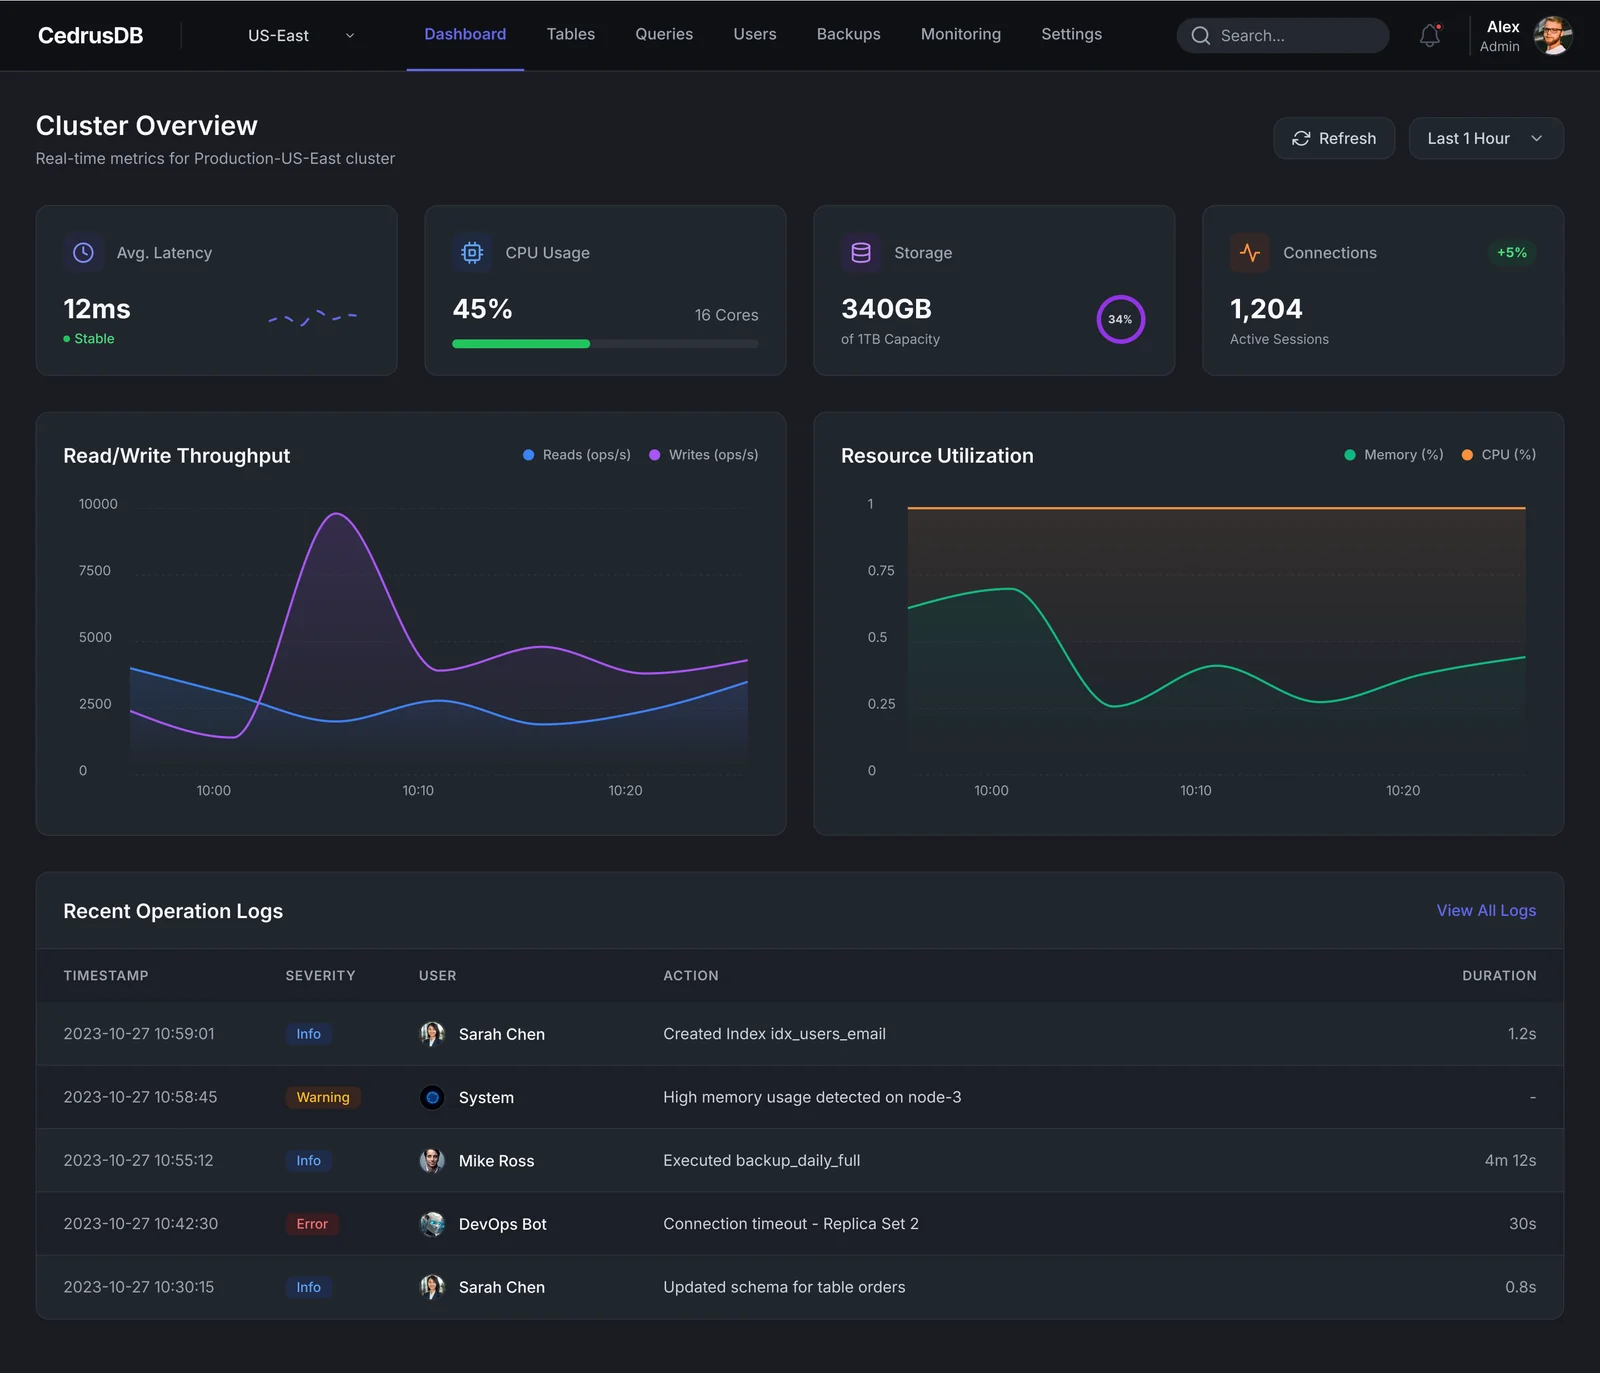
CedrusDB is the web console for a managed database service. Engineers use it to check a production cluster's health, look inside tables, run queries, decide who has access, and recover data when something goes wrong. It has seven pages, each designed in a dark and a light theme: Dashboard, Tables, Queries, Users, Backups, Monitoring and Settings.
Key features
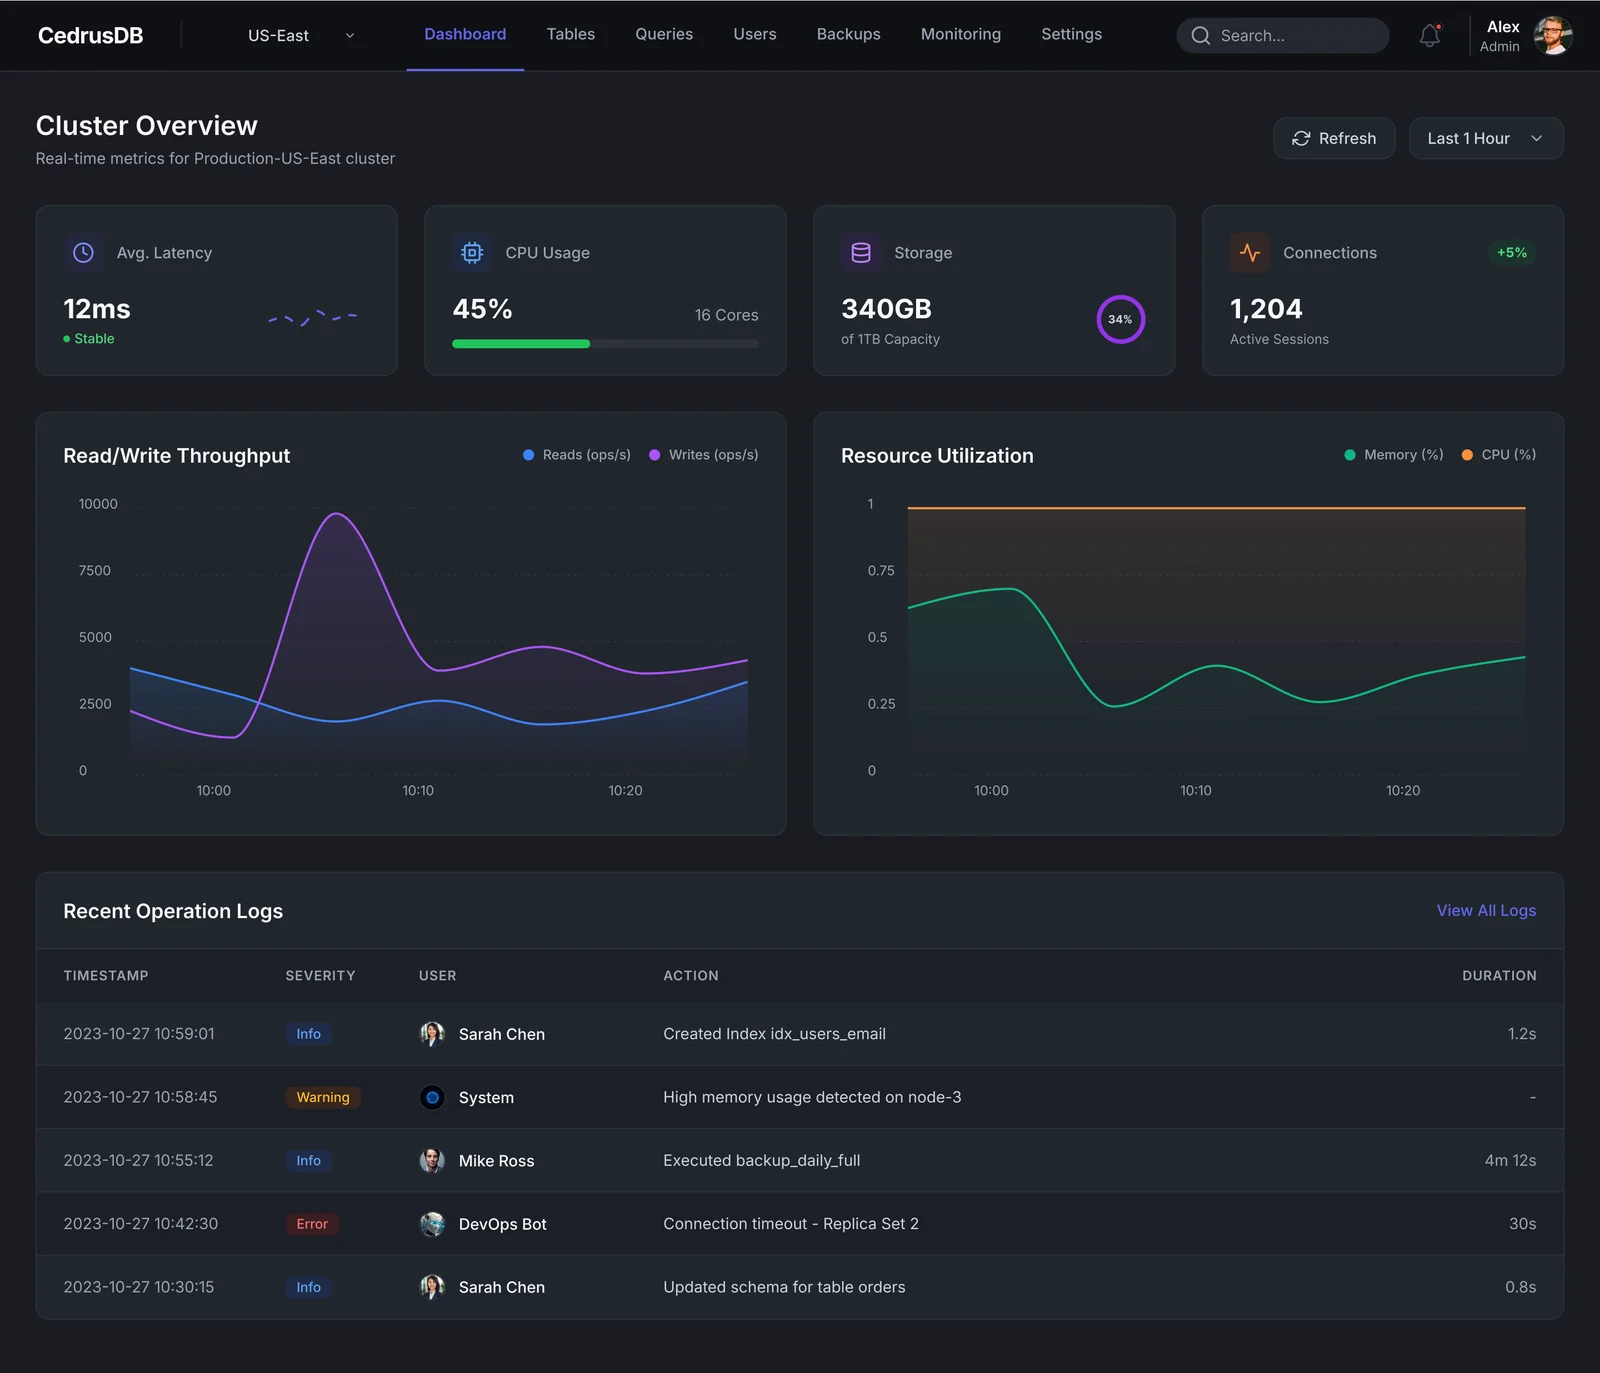
- Cluster overview. Latency, CPU, storage and active connections at a glance, read/write throughput and resource charts, and a log of recent operations by severity.
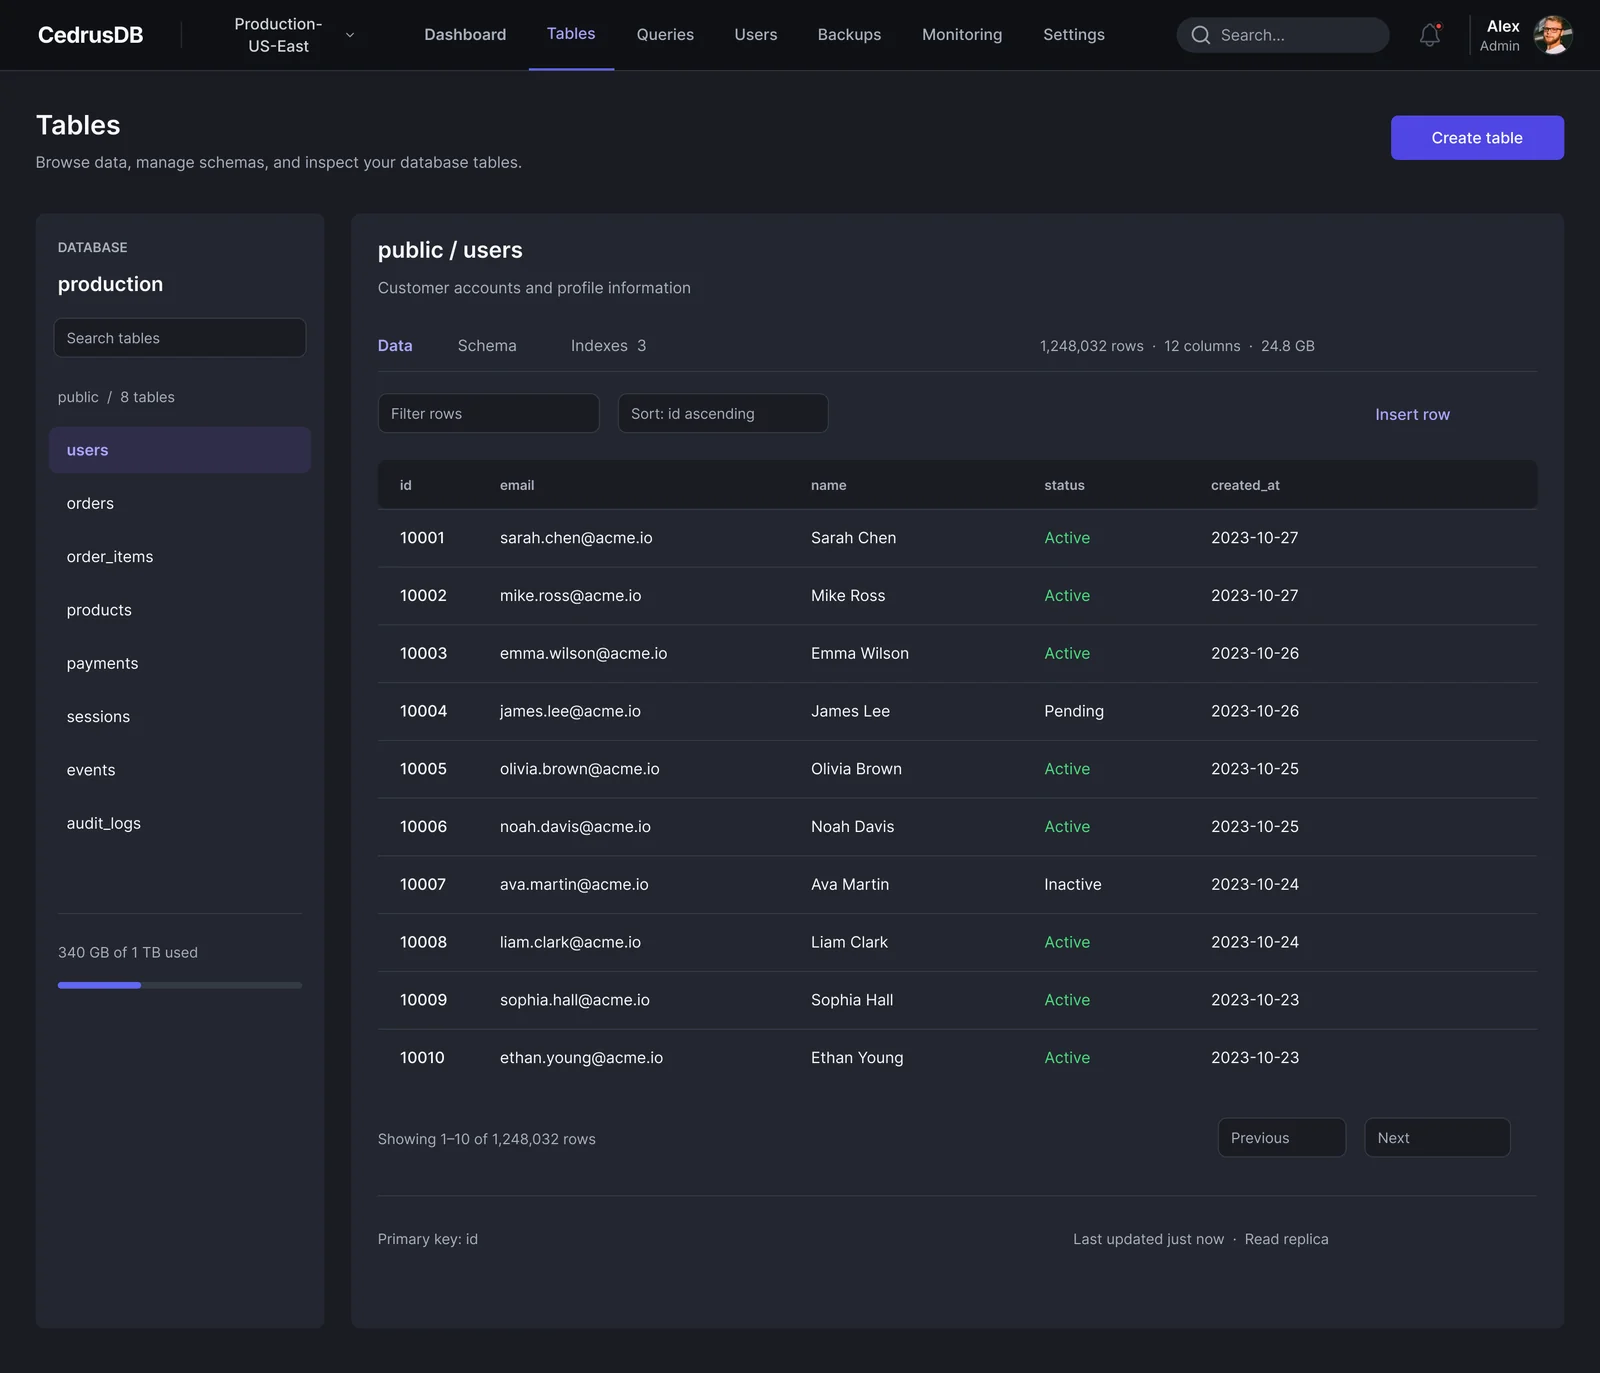
- Table browser. Pick a table from the schema list, then switch between its data, schema and indexes, with filters, sorting and row counts.
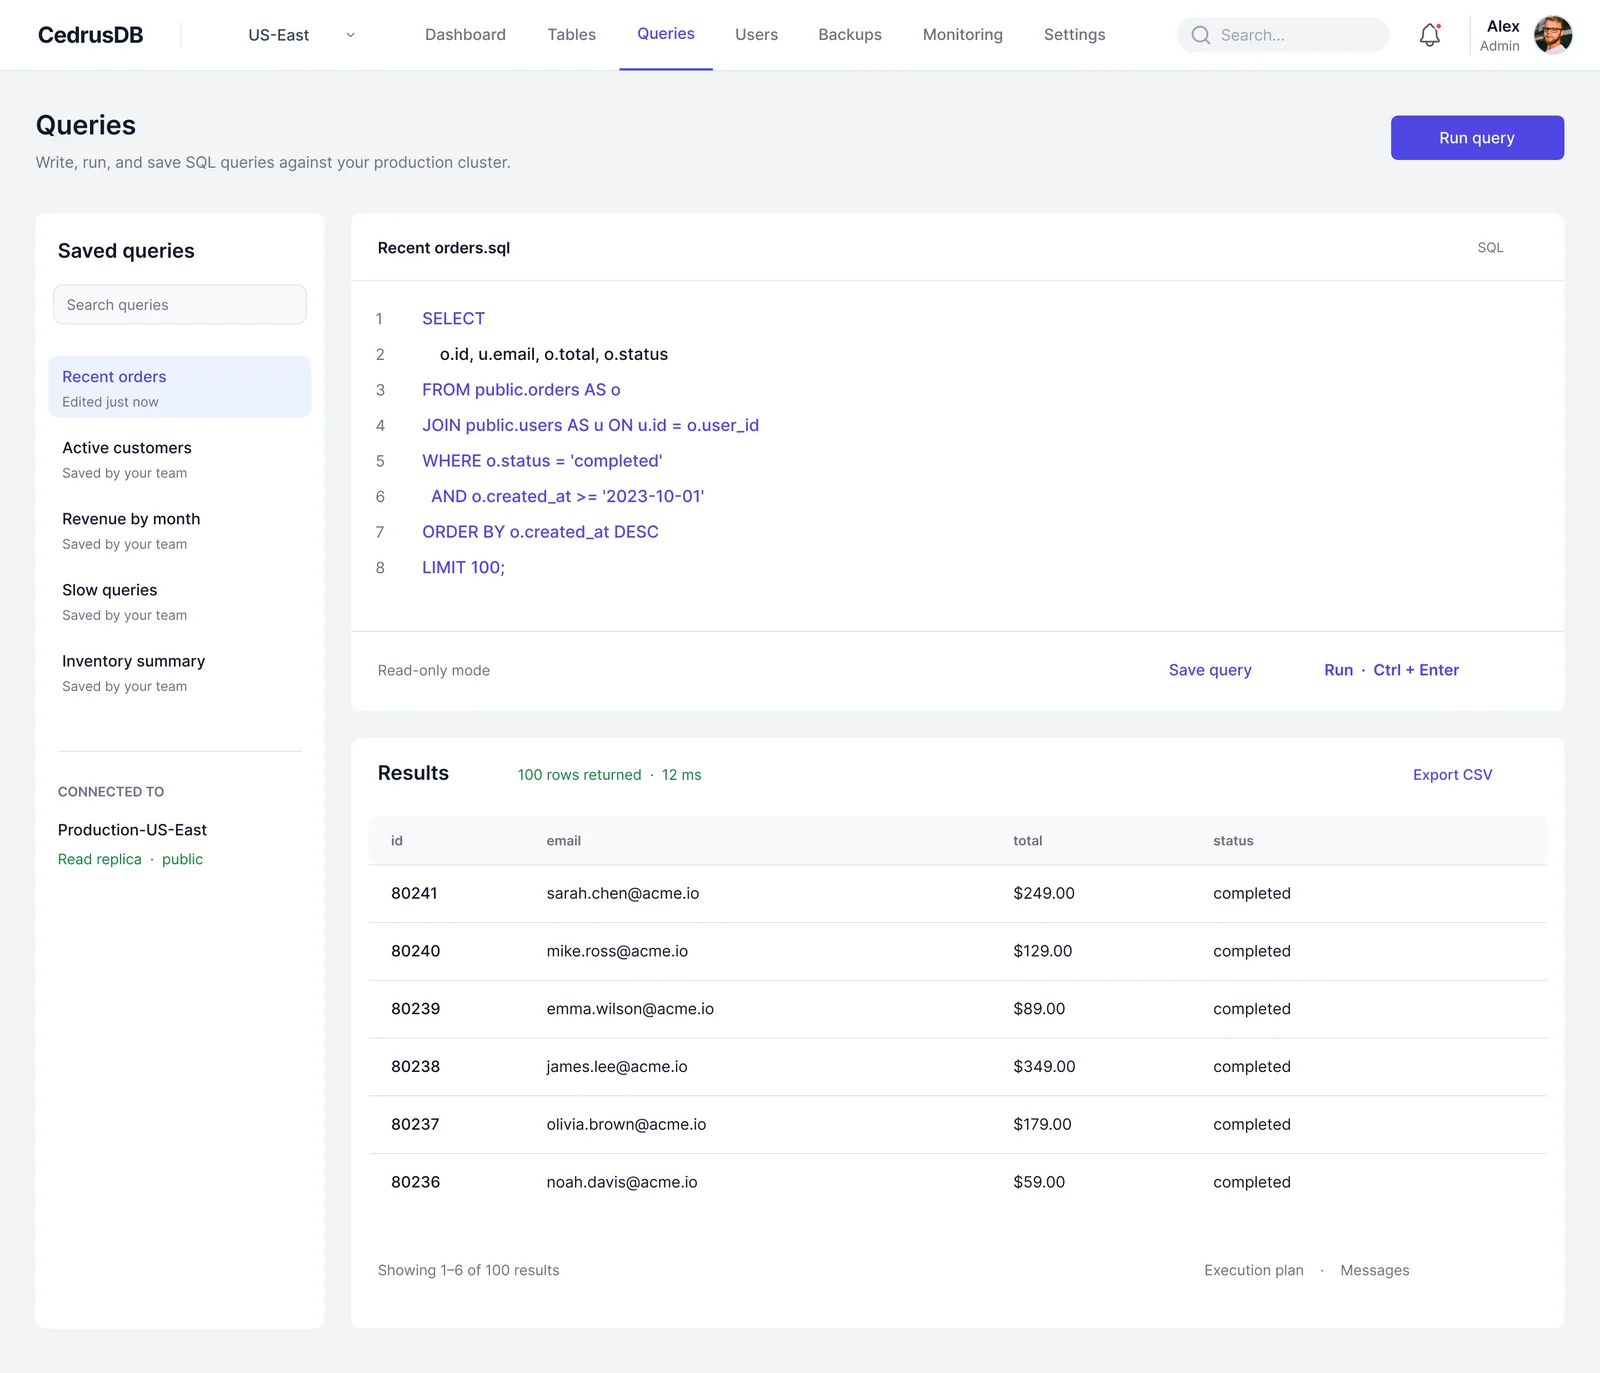
- Query editor. Saved queries on the left, a SQL editor with syntax colours and a read-only mode, and results with row count and run time underneath.
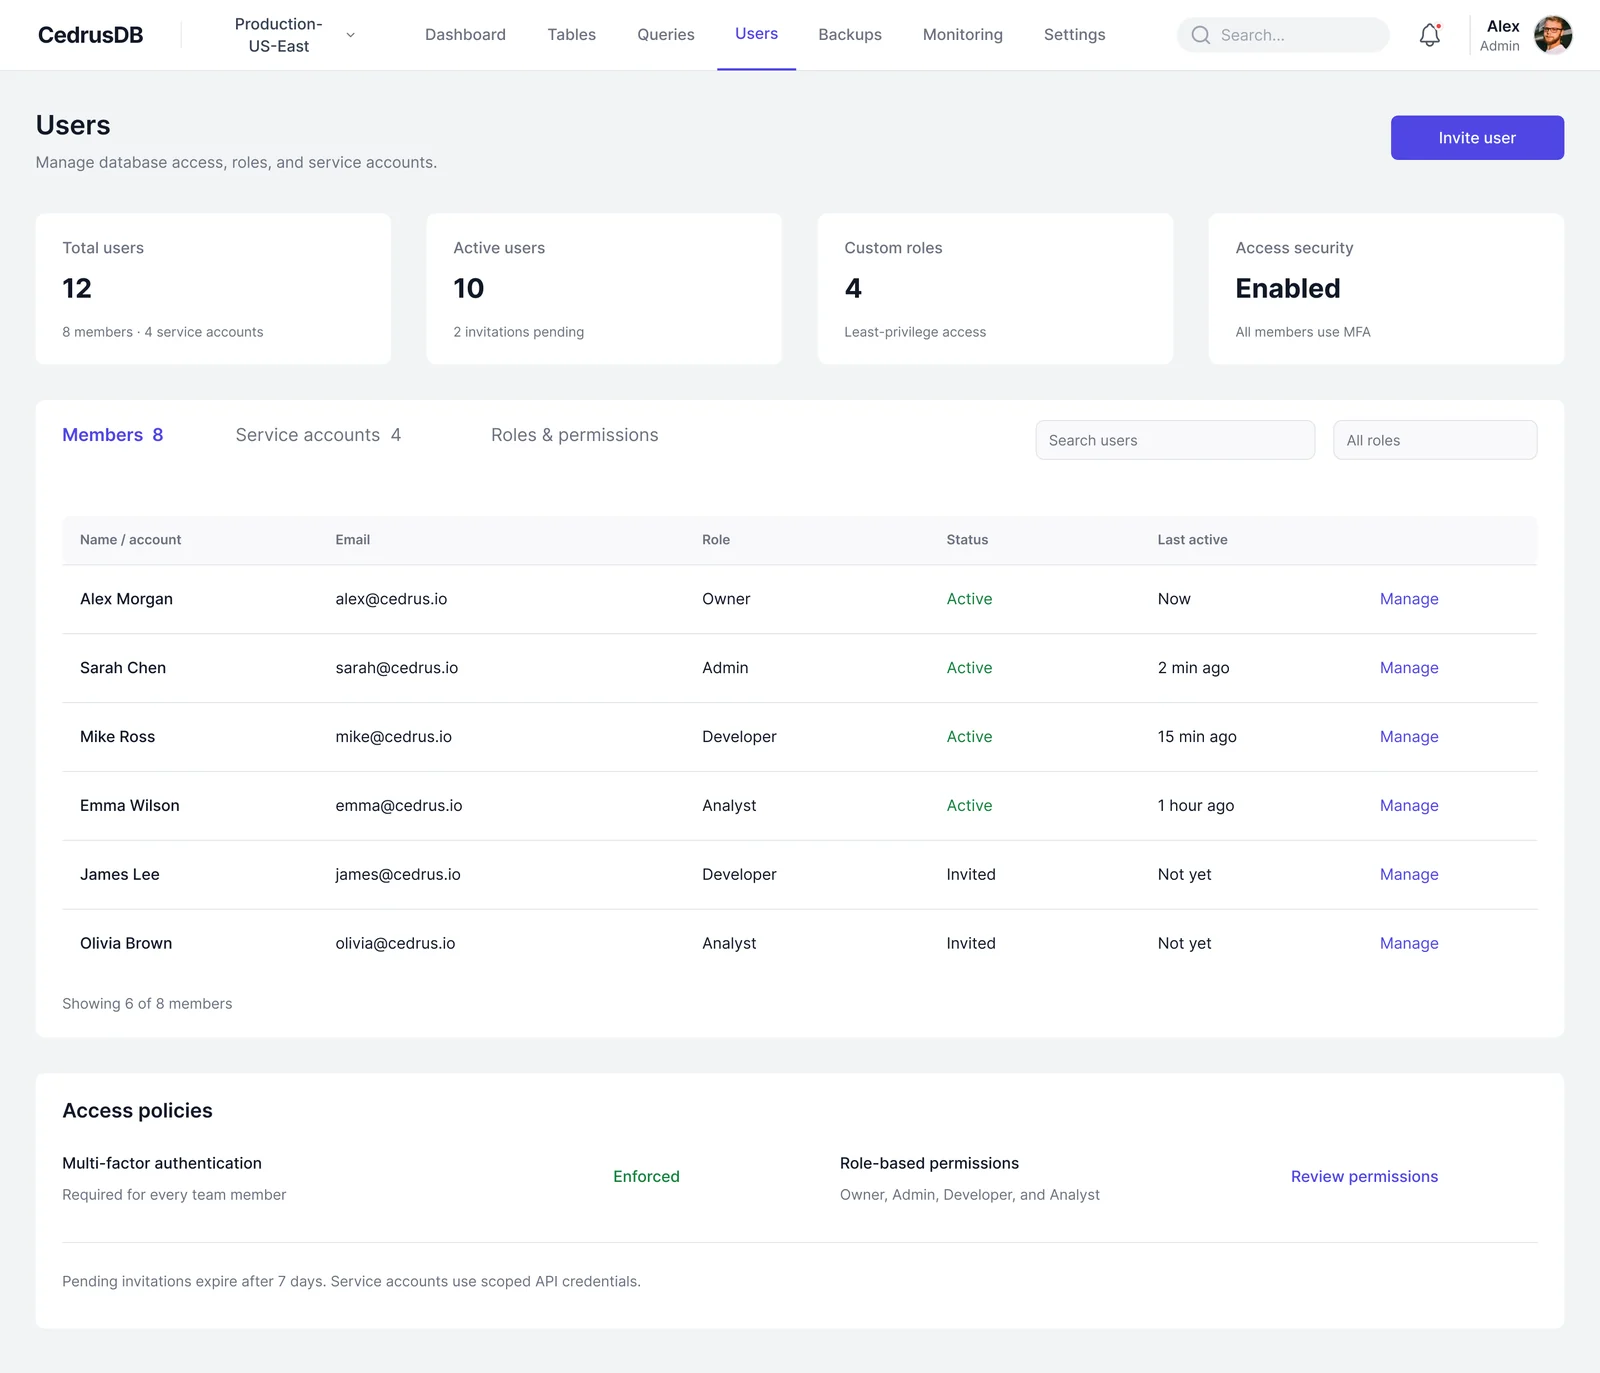
- Users and access. Members, service accounts and roles, with status and last activity, plus the access policies (MFA, role-based permissions) in plain words.
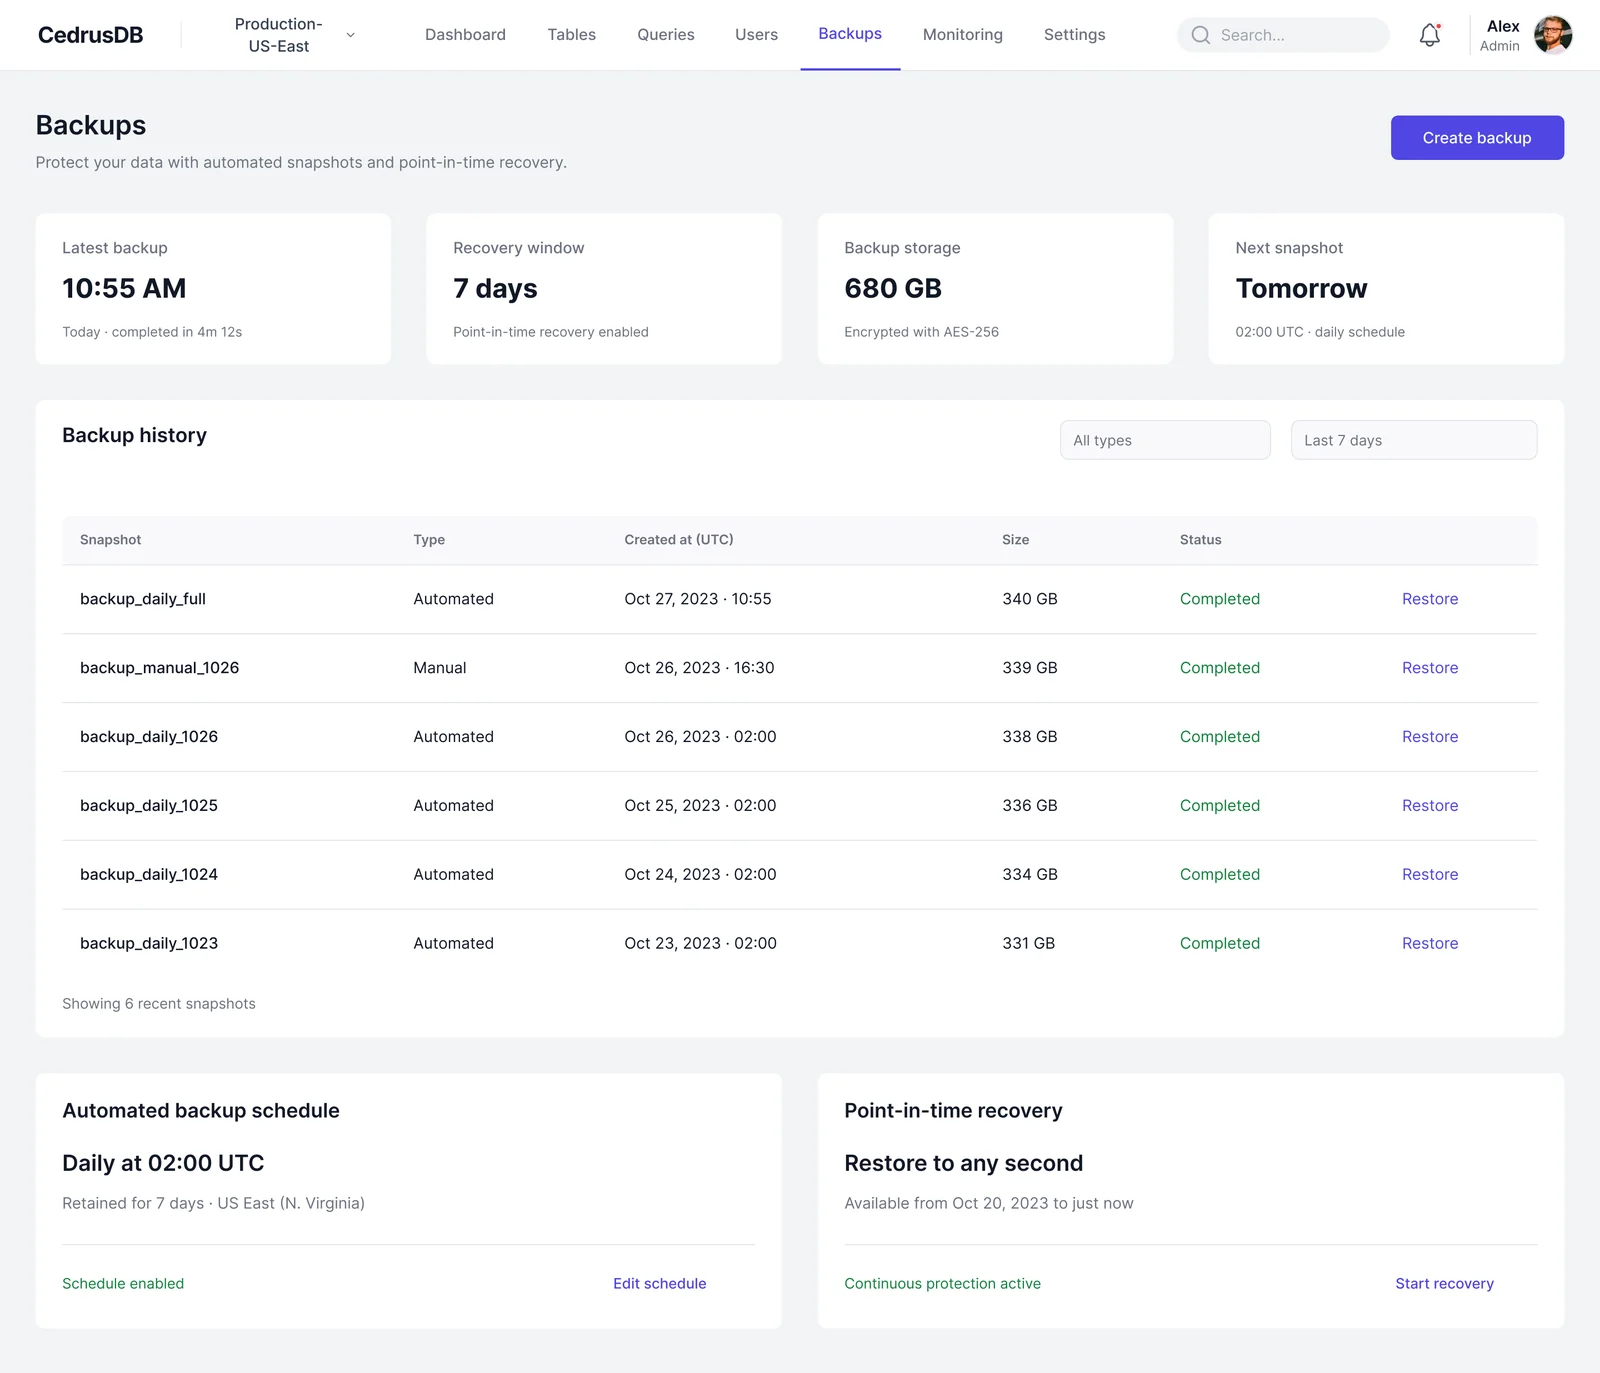
- Backups. Latest snapshot, recovery window and storage, a history with one-click restore, and point-in-time recovery.
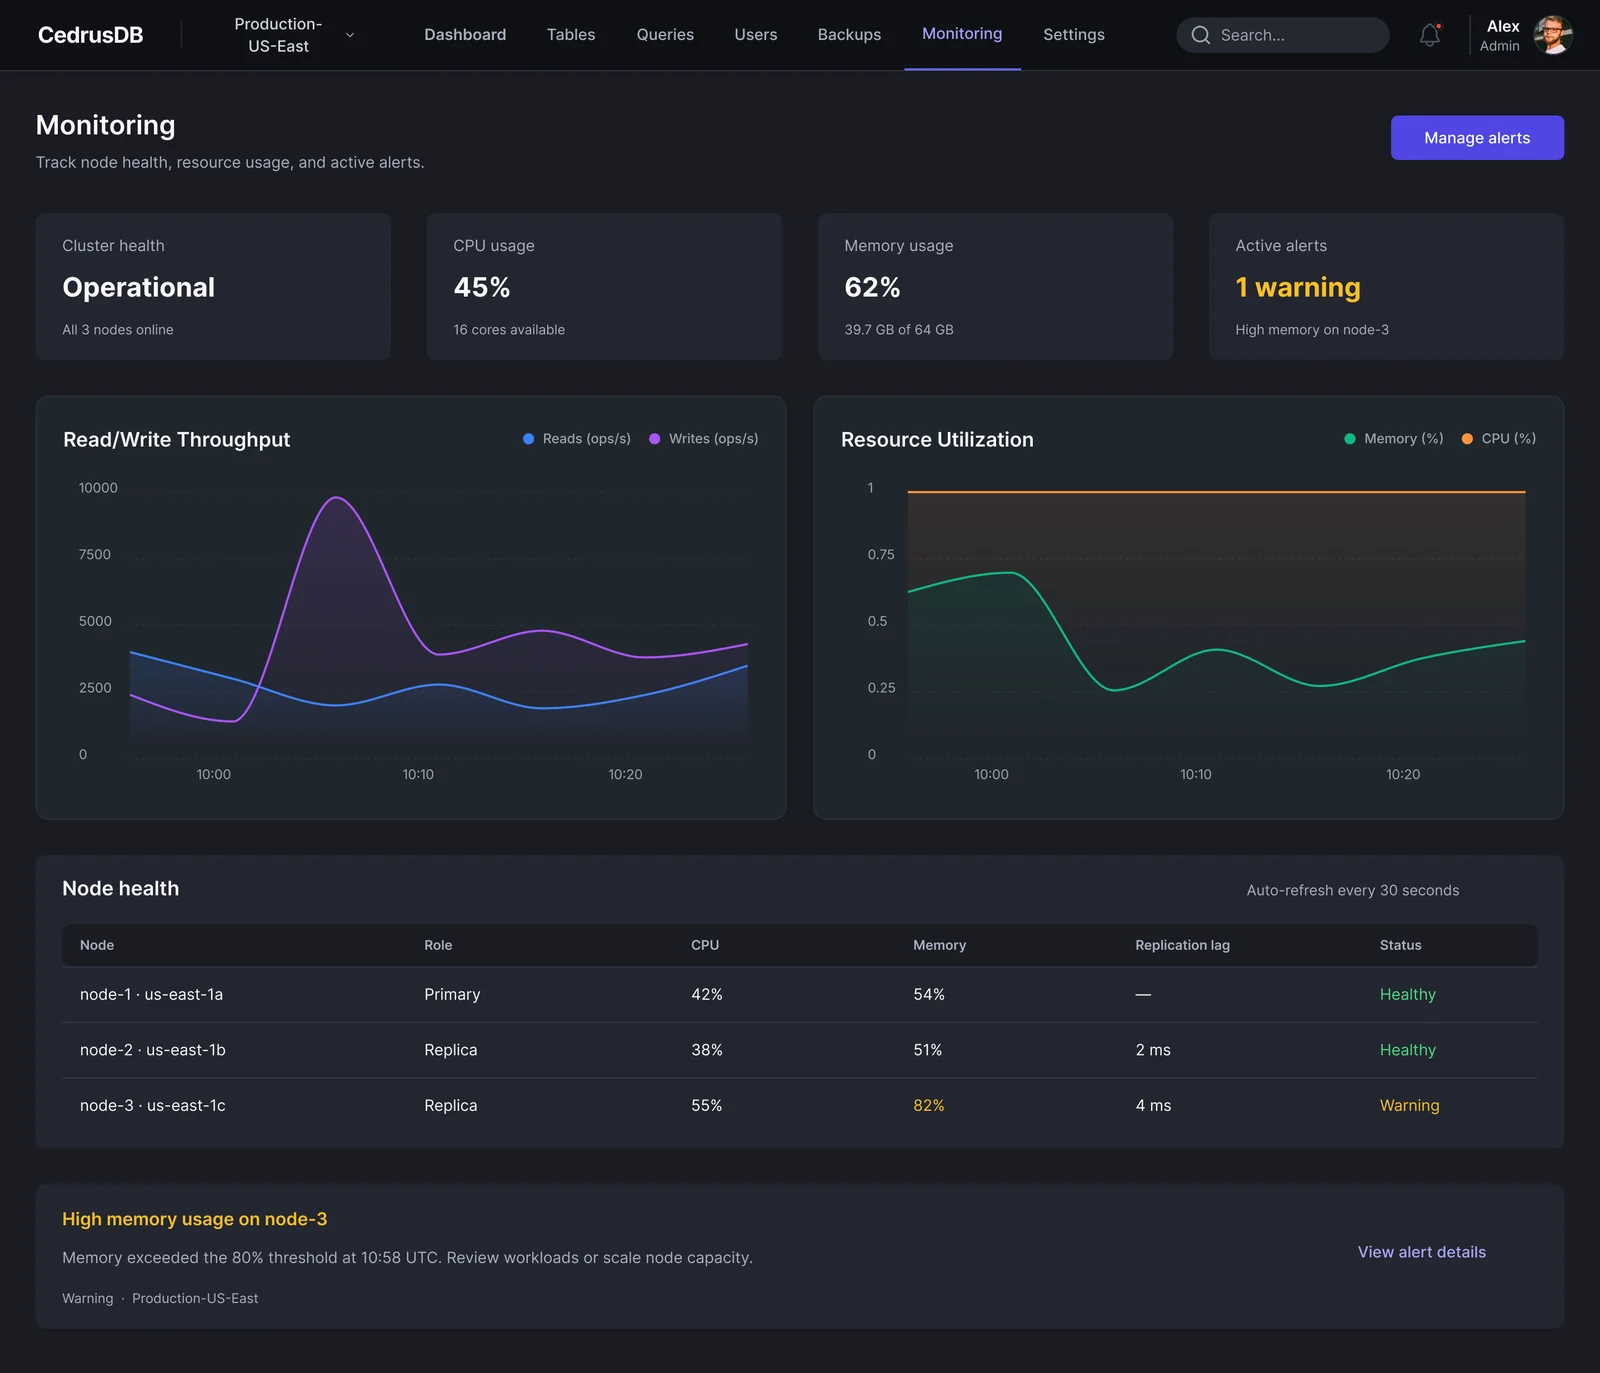
- Monitoring. Node health with replication lag and an alert that explains the problem and the next step.
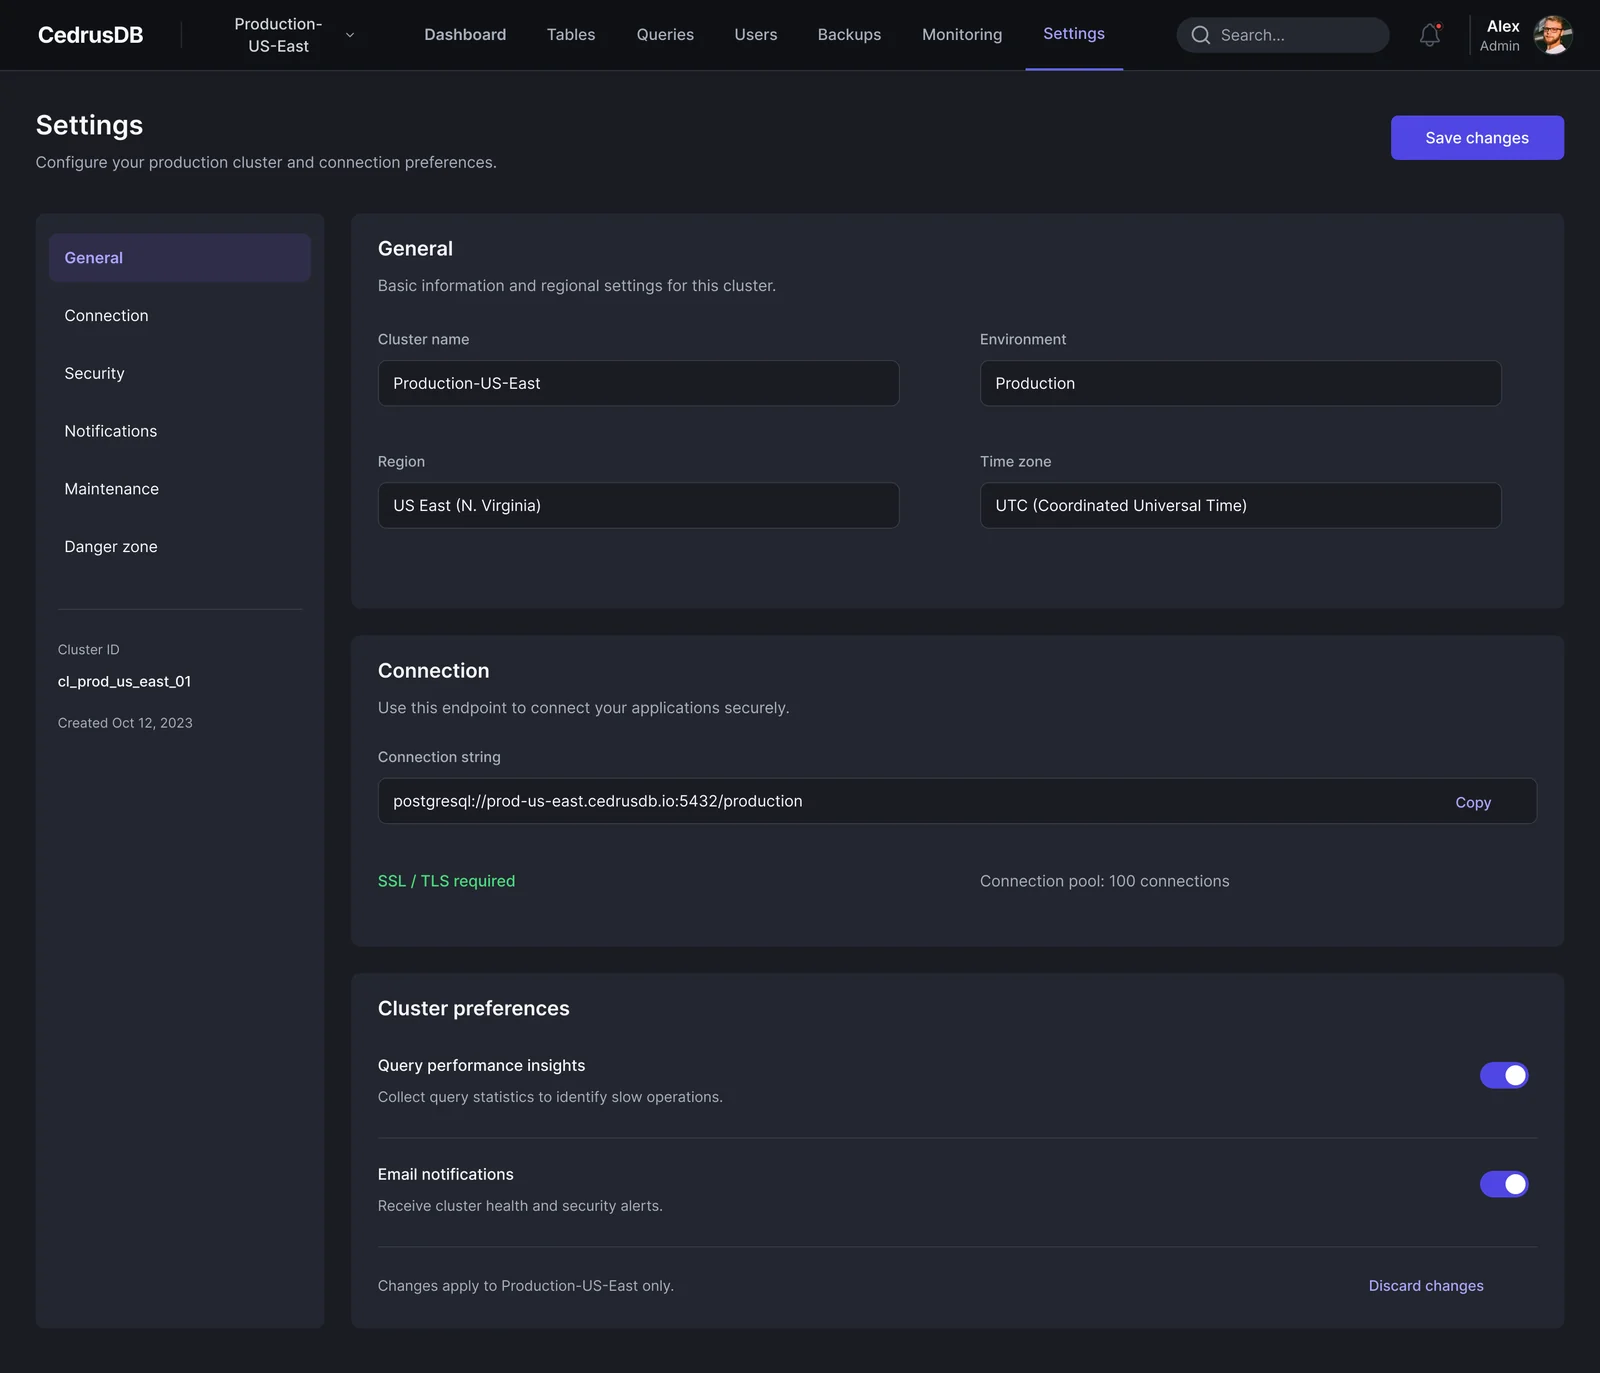
- Settings. Cluster details, a copyable connection string, preferences and a separate danger zone.
Visual style
The console is built for long sessions and dense data, so it is calm: graphite surfaces in dark (cool grays in light), one indigo for actions and the active tab, and a strict set of data colours for the charts (blue for reads, violet for writes, emerald for memory, orange for CPU). Status uses its own small palette (green, amber, red) that is never reused for decoration. The SQL editor and IDs use a monospaced face, so code reads like code.
Colour palette
Brand and data
Indigo
#4F46E5
Primary actions, active tab
Violet
#A855F7
Write throughput, storage ring
Blue
#3B82F6
Read throughput, info logs
Emerald
#10B981
Memory, healthy, completed
Orange
#F97316
CPU series
Amber
#F59E0B
Warnings
Red
#EF4444
Errors, danger zone
Surfaces and text
Top bar
#0F1115
Navigation bar in dark
Graphite
#1A1D24
Page background in dark
Panel
#23272F
Cards in dark
Line dark
#343A46
Borders in dark
Gray 100
#F3F4F6
Page background in light
Gray 900
#111827
Text in light
Gray 500
#6B7280
Secondary text
The full UI kit for this project is in the CedrusDB design system.
More screens