LebUni Data
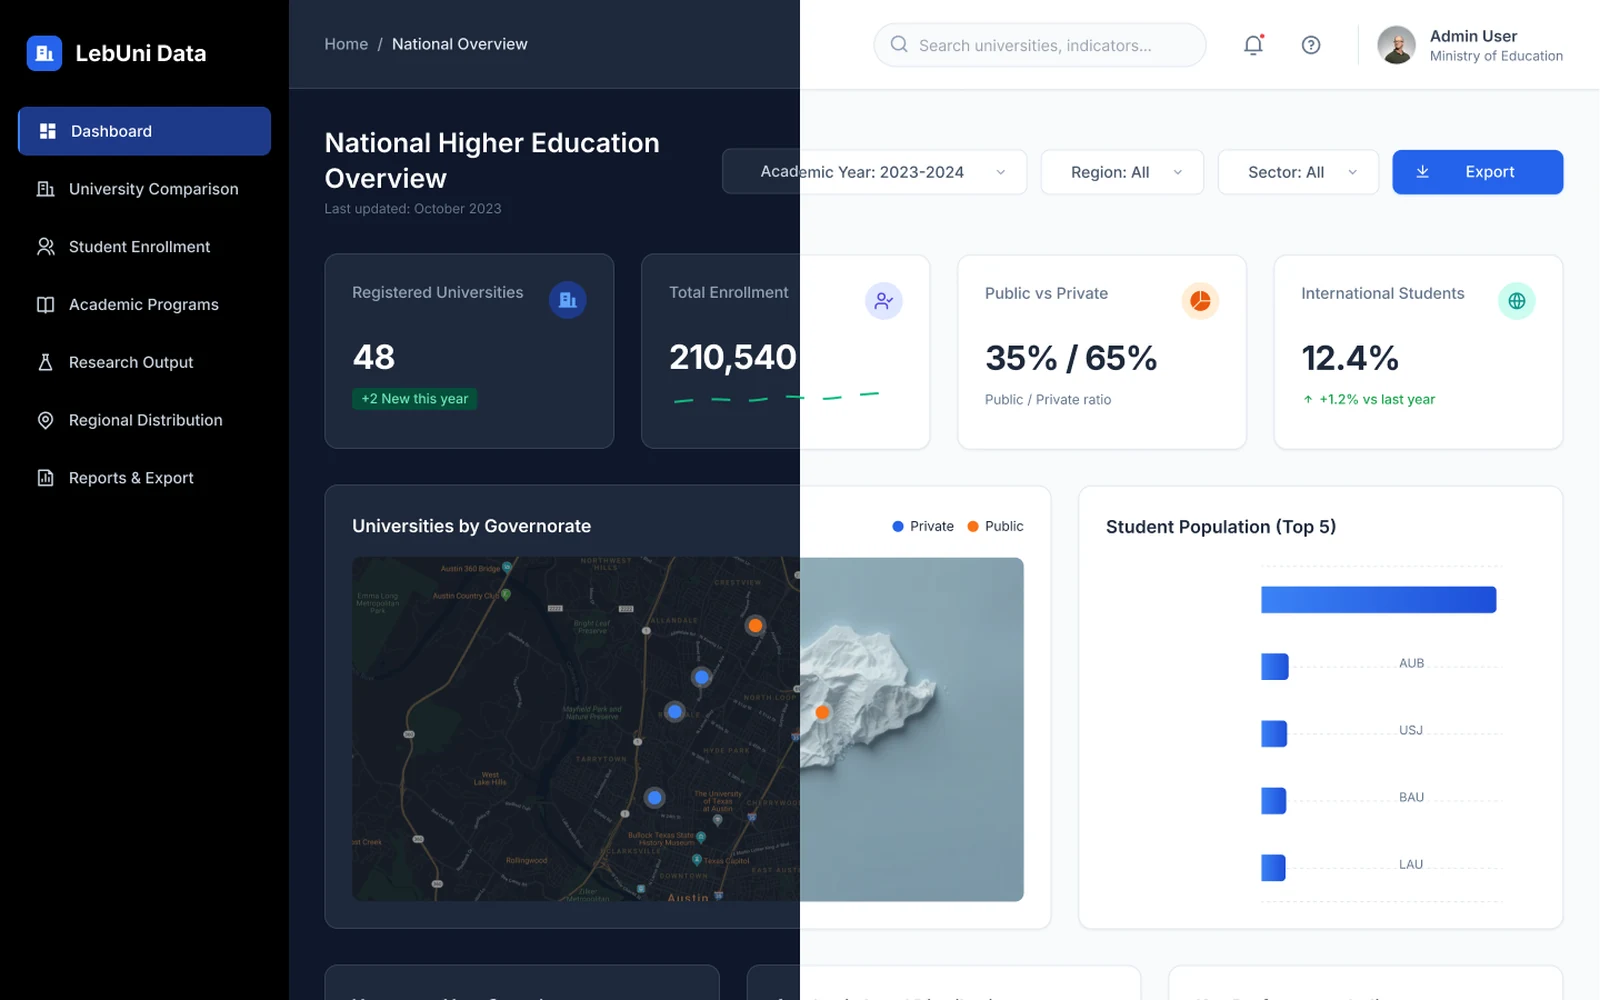
A national higher-education dashboard that brings Lebanon's 48 universities, 210,000 students and their research into one place, designed in matching dark and light themes.
- Role
- UX/UI designer
- Year
- 2026
The project
LebUni Data is an analytics dashboard for the Ministry of Education. It gathers data on Lebanon's higher-education sector (universities, enrollment, programs, research and regional coverage) in one tool, so a ministry analyst can answer a question without combining spreadsheets from 48 institutions.
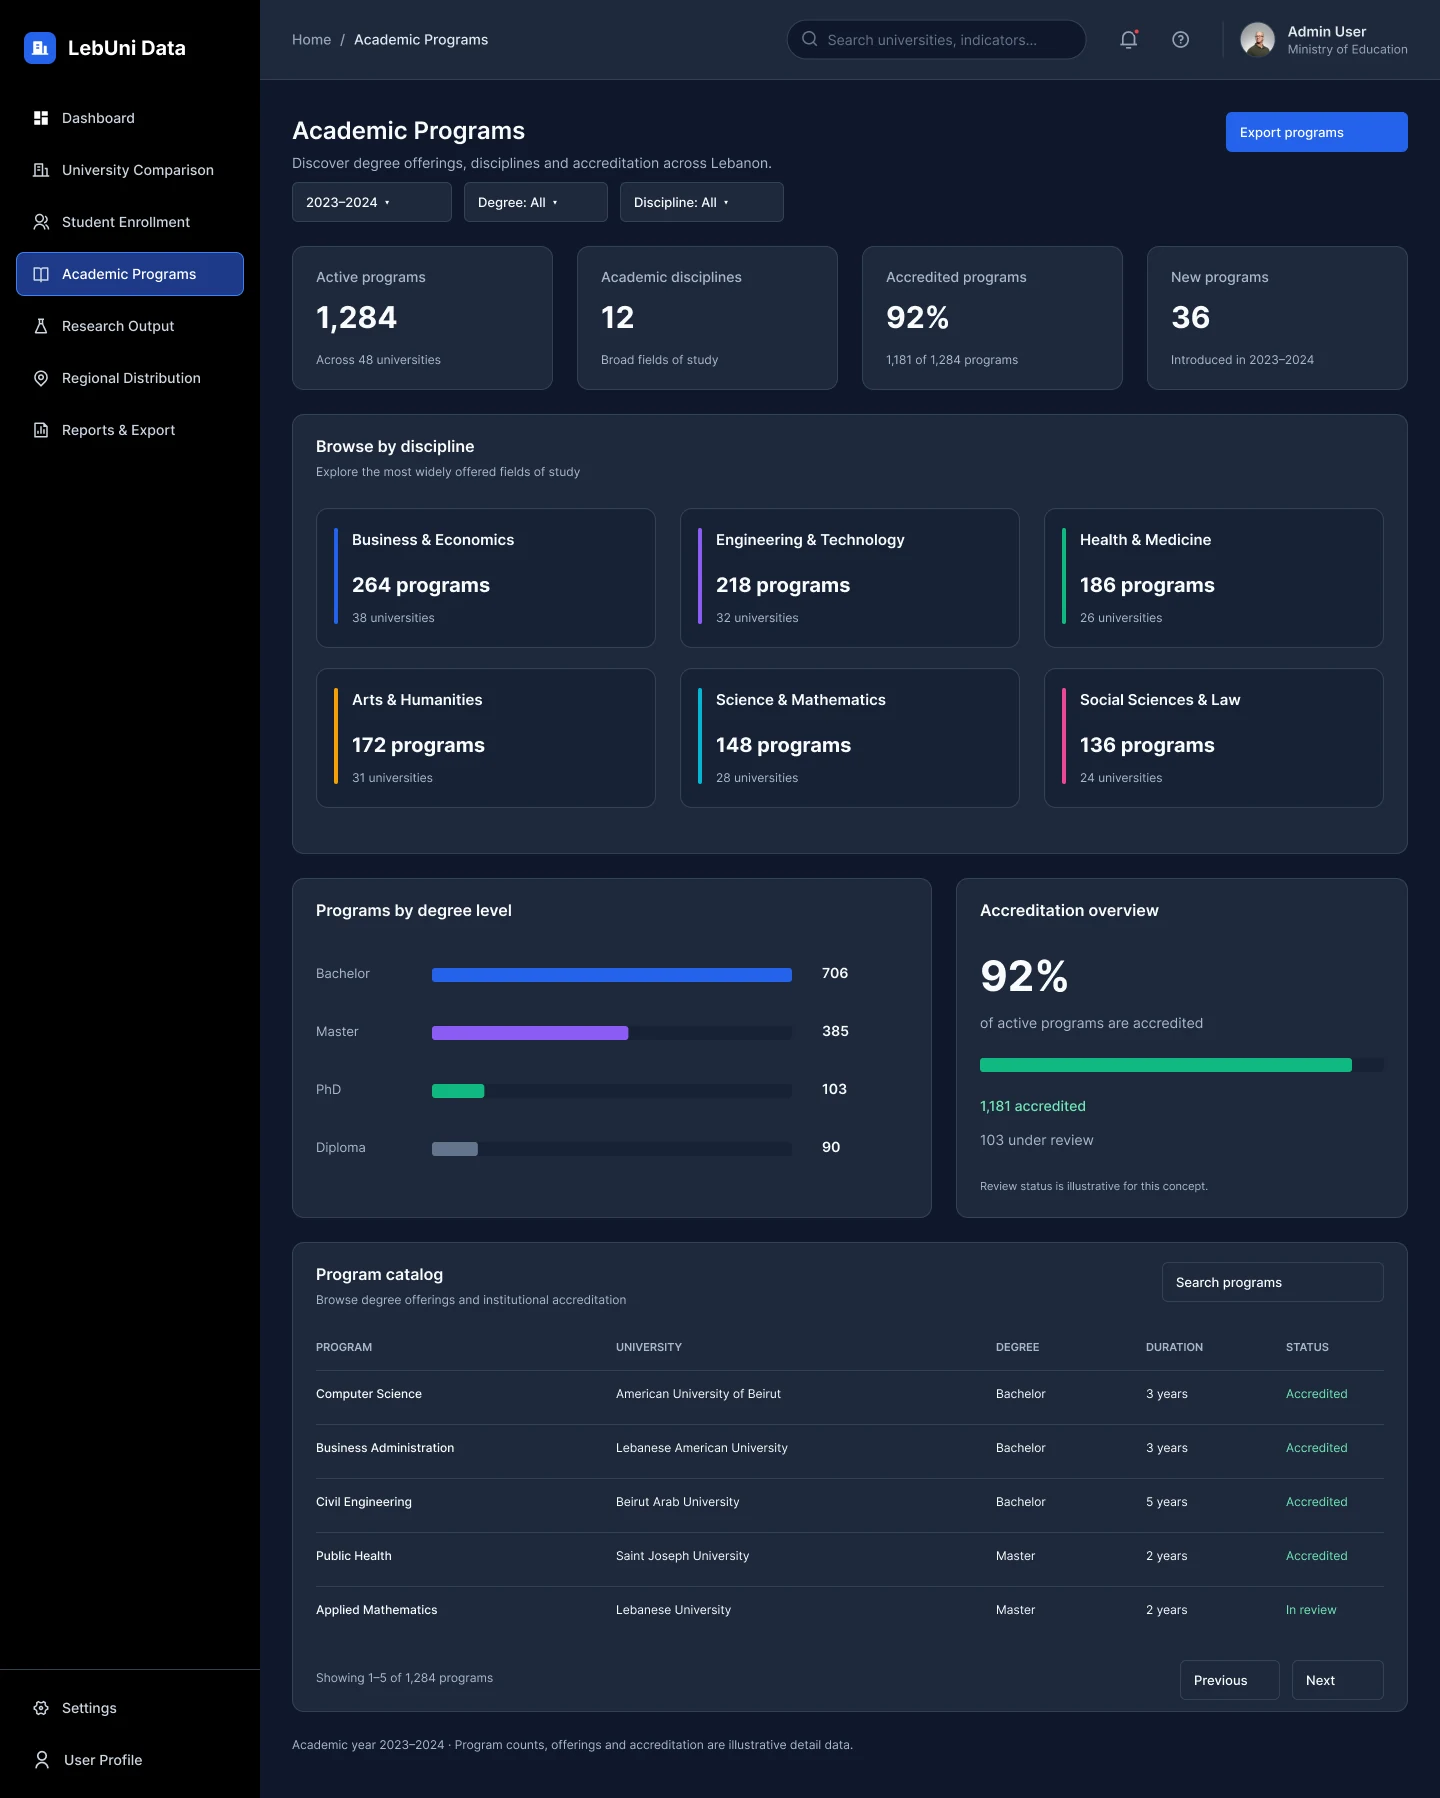
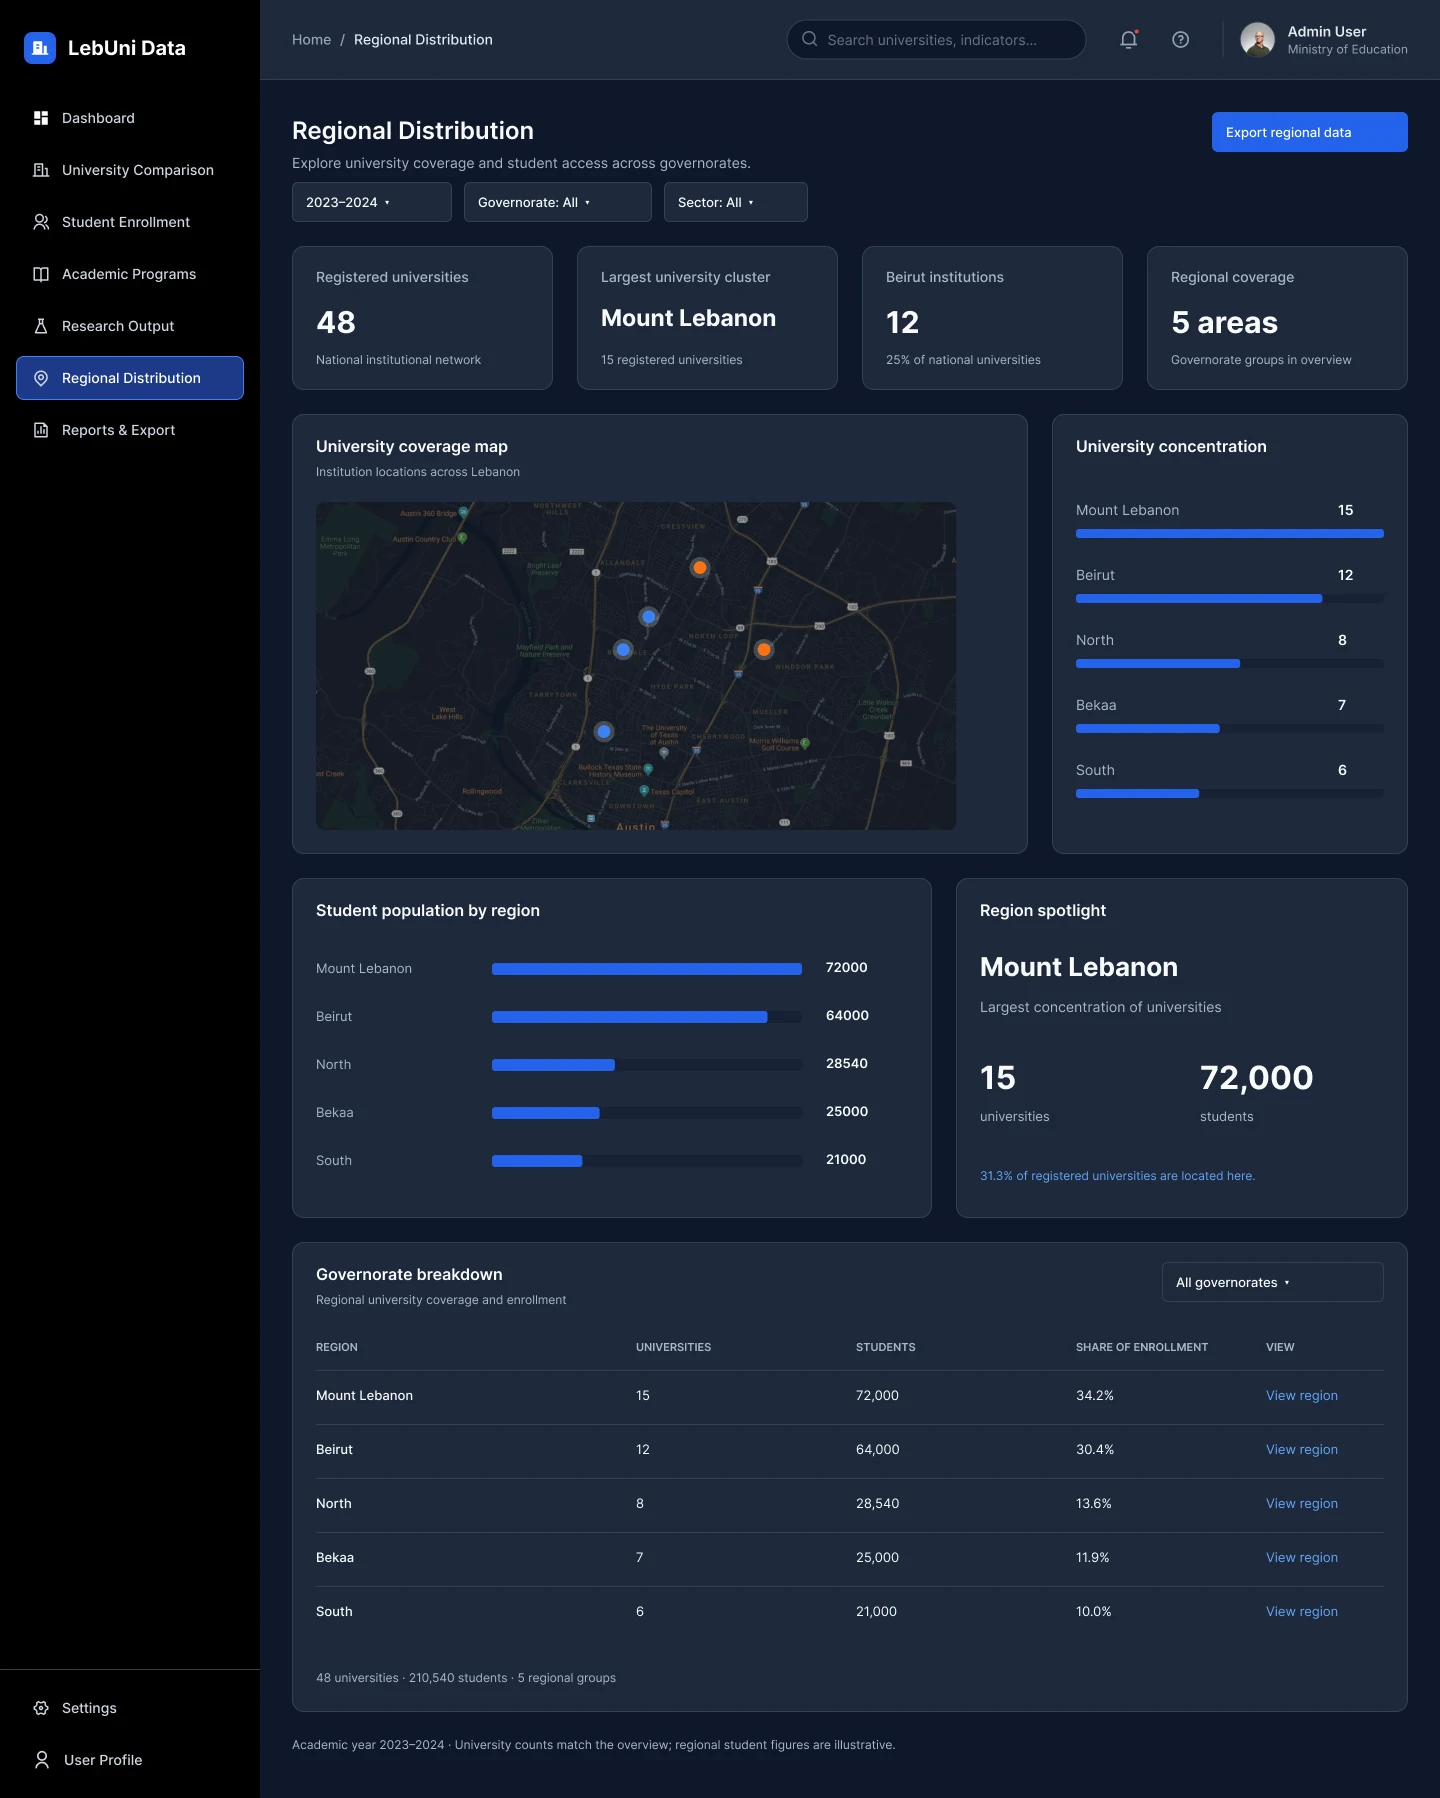
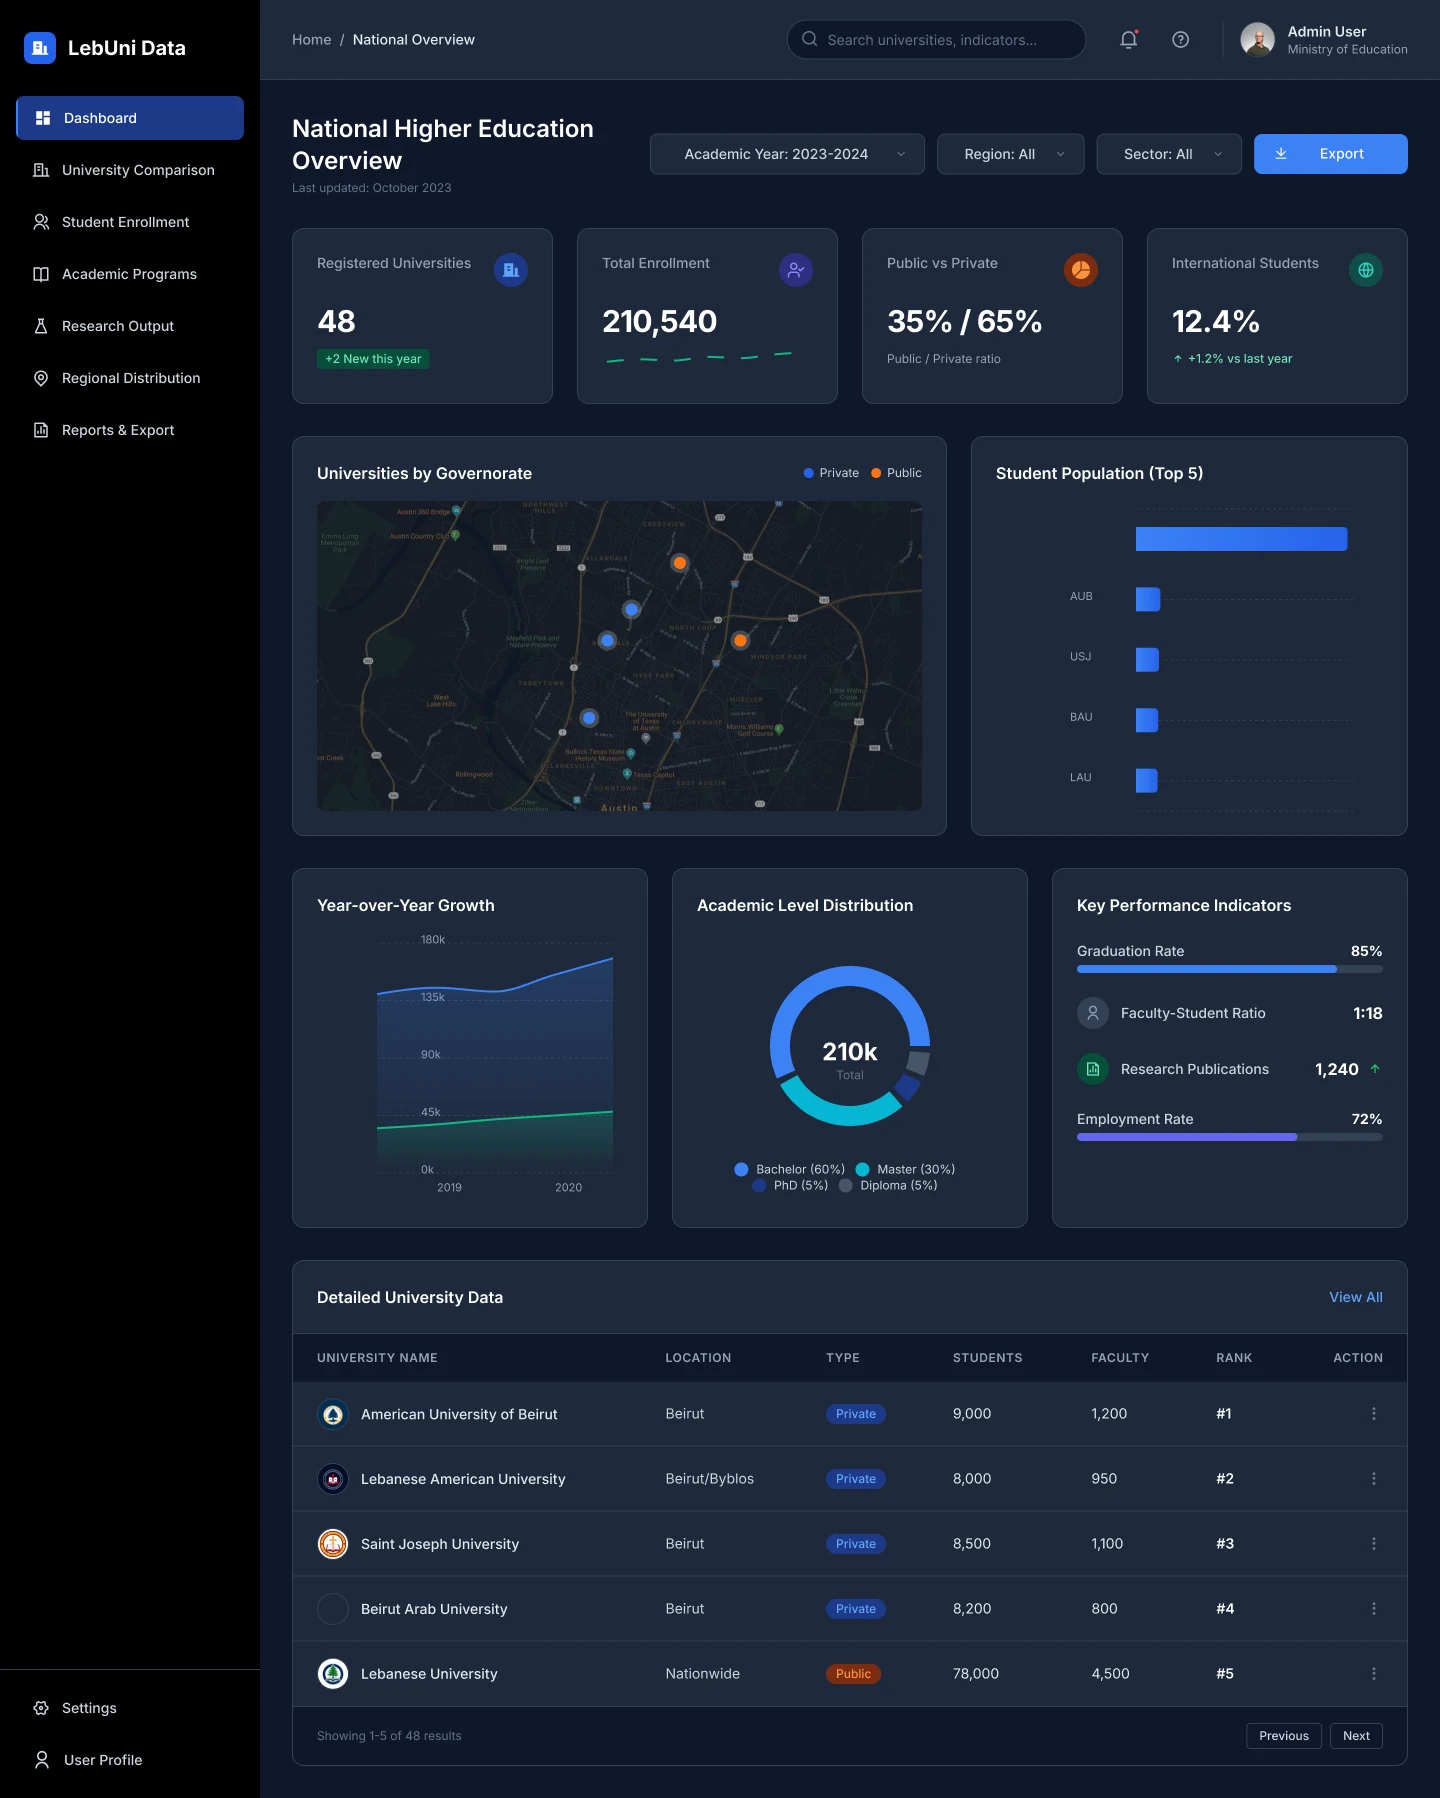
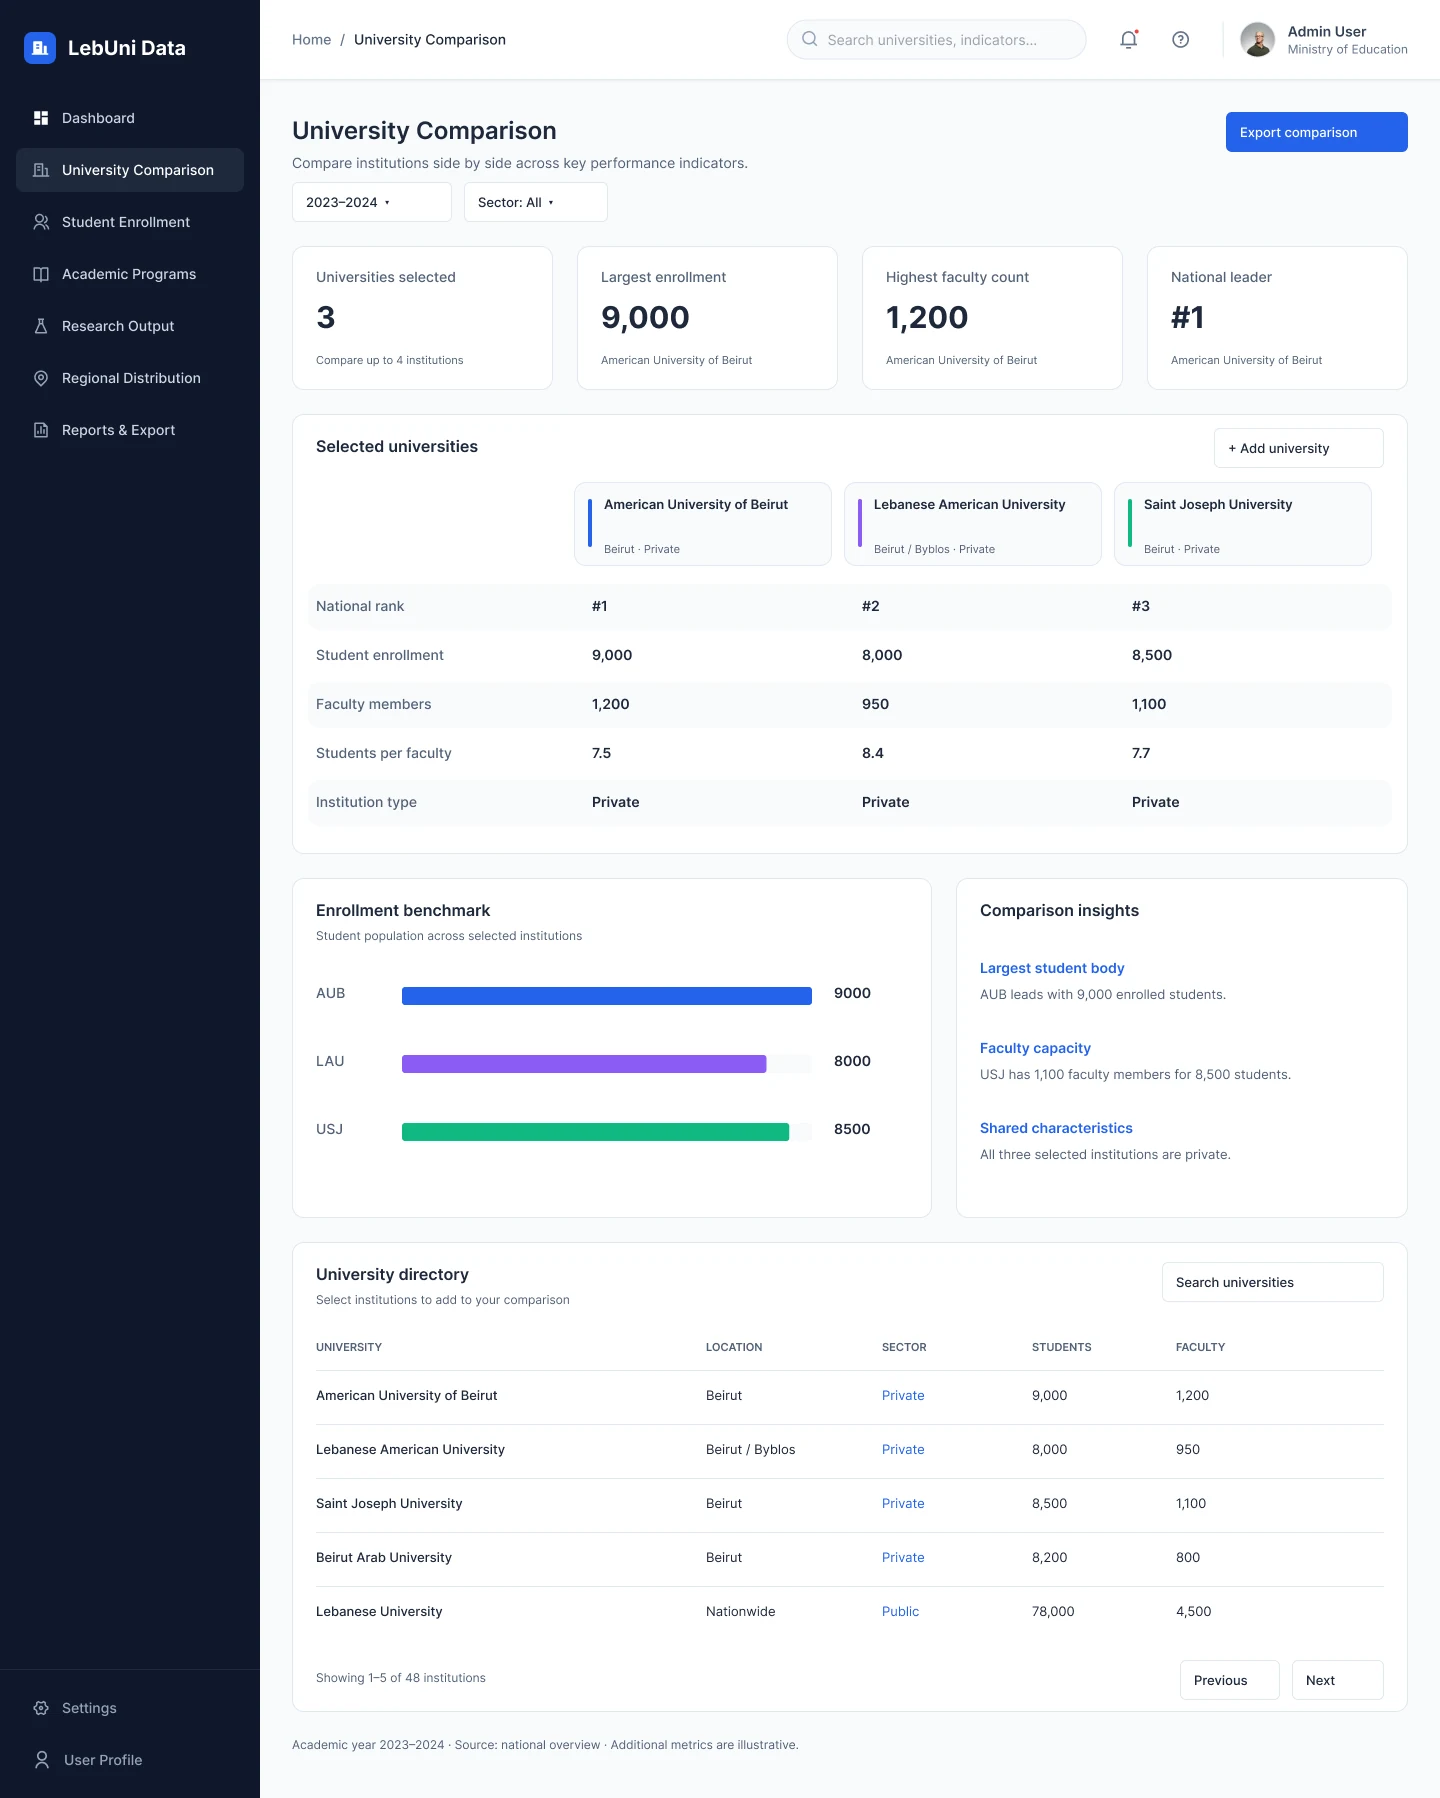
The product has seven pages, each designed in dark and light themes: National Overview, University Comparison, Student Enrollment, Academic Programs, Research Output, Regional Distribution and Reports & Export.
The challenge
Higher-education data is dense and comes from many sources. The people using it need two very different things: a quick read of the national picture for a briefing, and the exact numbers behind it for a report. The design had to serve both without turning every page into a wall of charts.
Process
1. Define the questions first. I started from the questions an analyst actually asks: How many universities and students are there? How do institutions compare? Where are they? What is growing? Each question became a page, which gave the navigation its seven items.
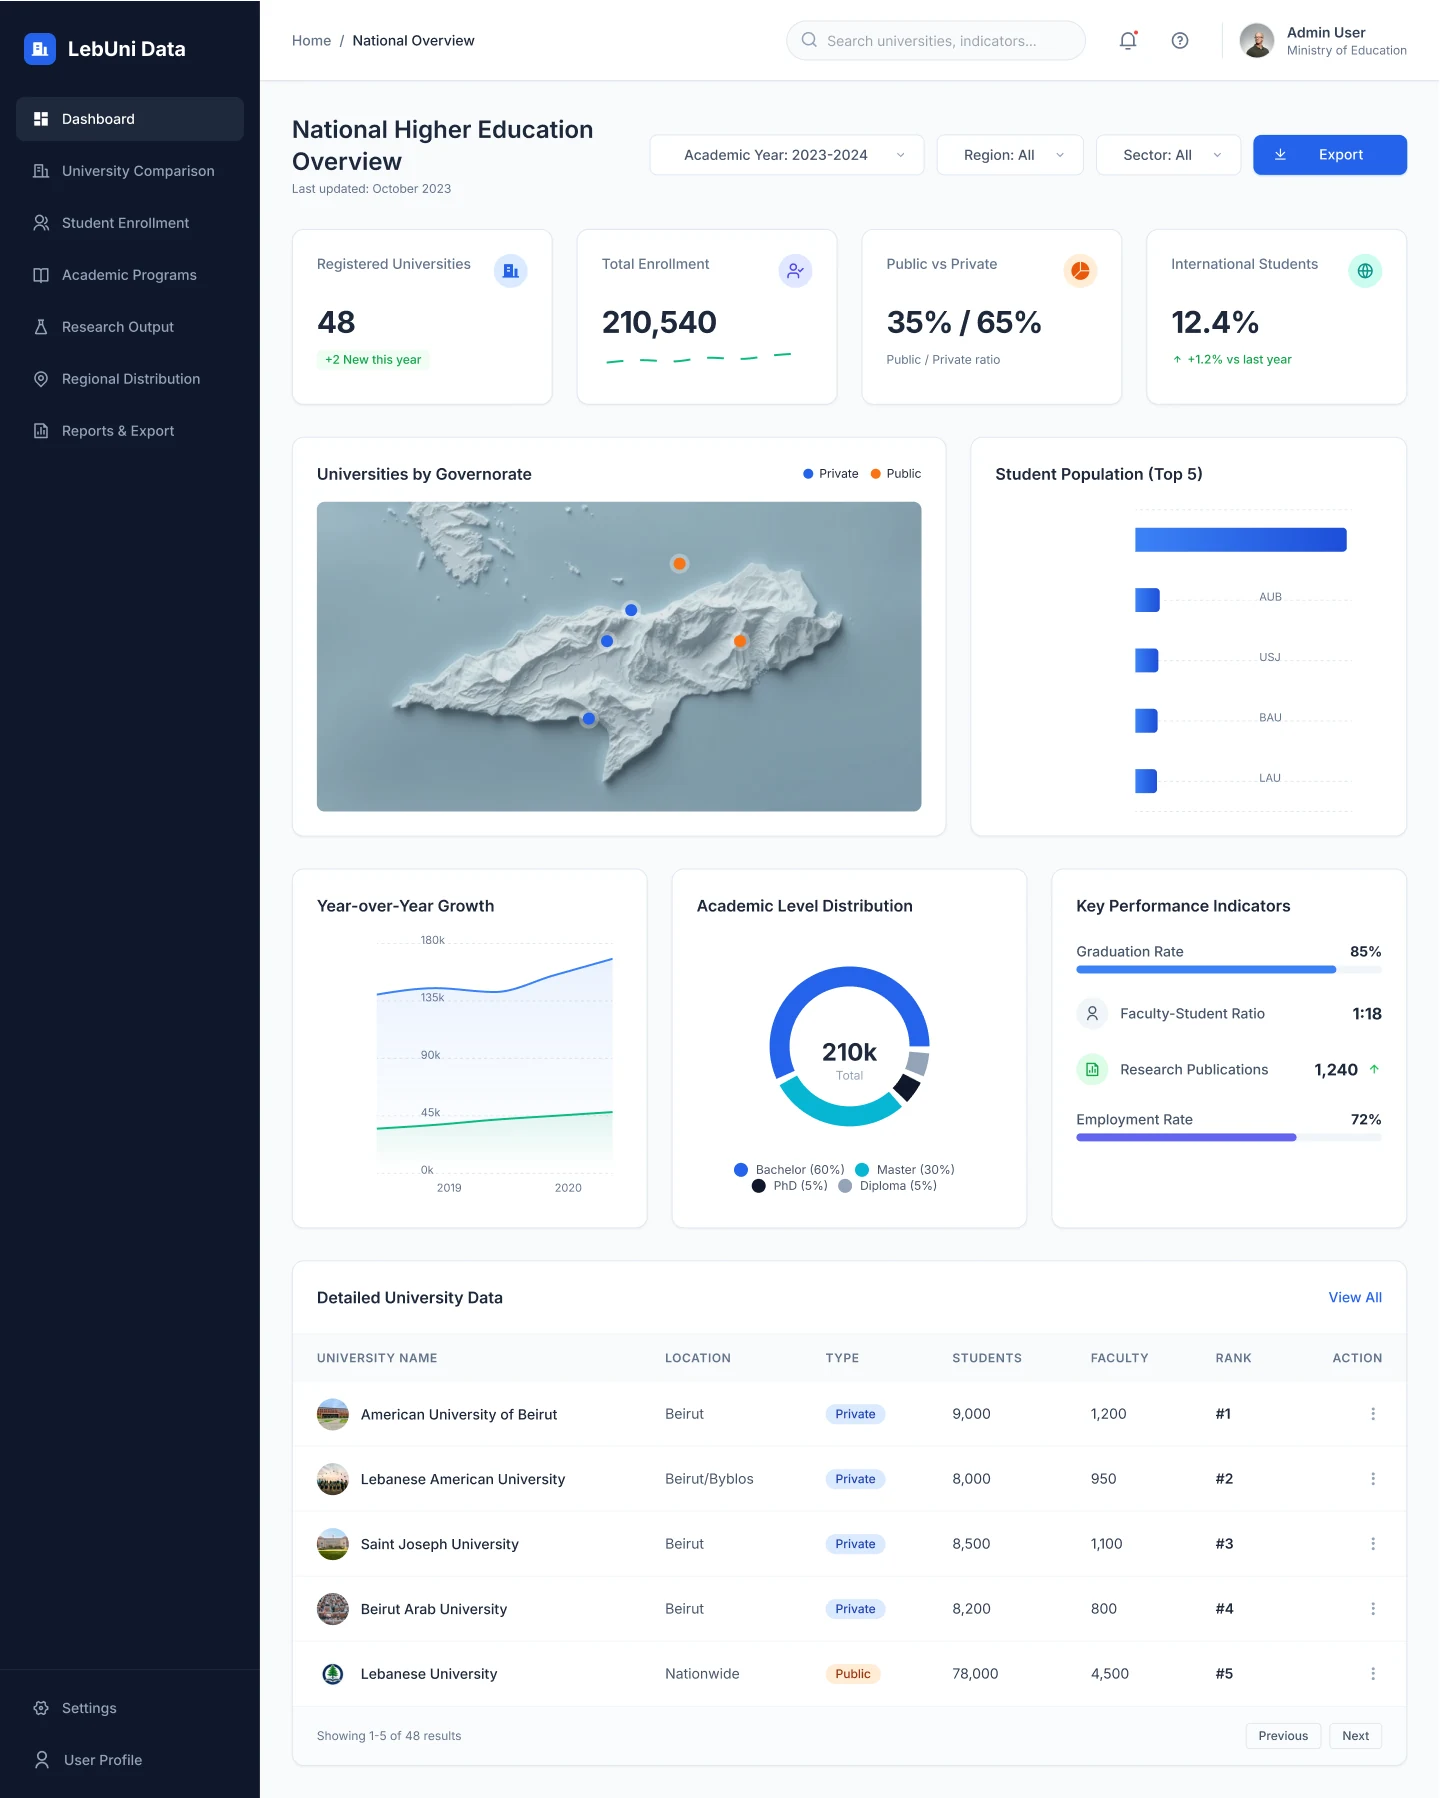
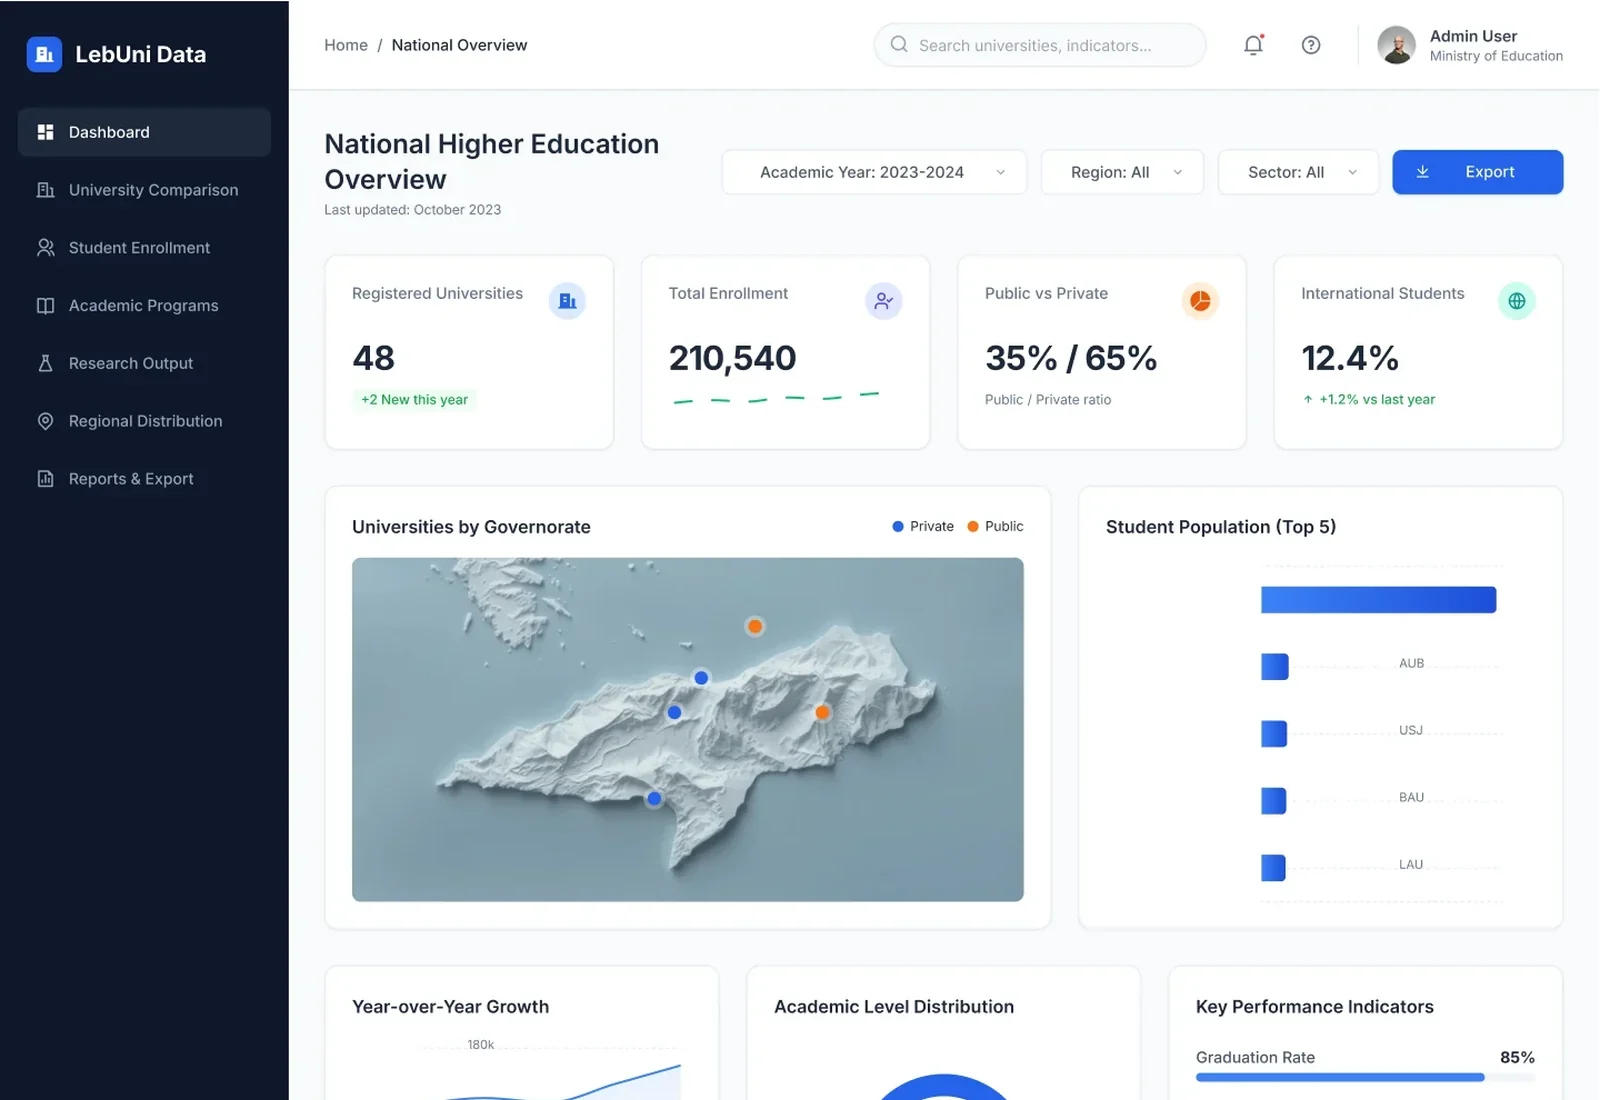
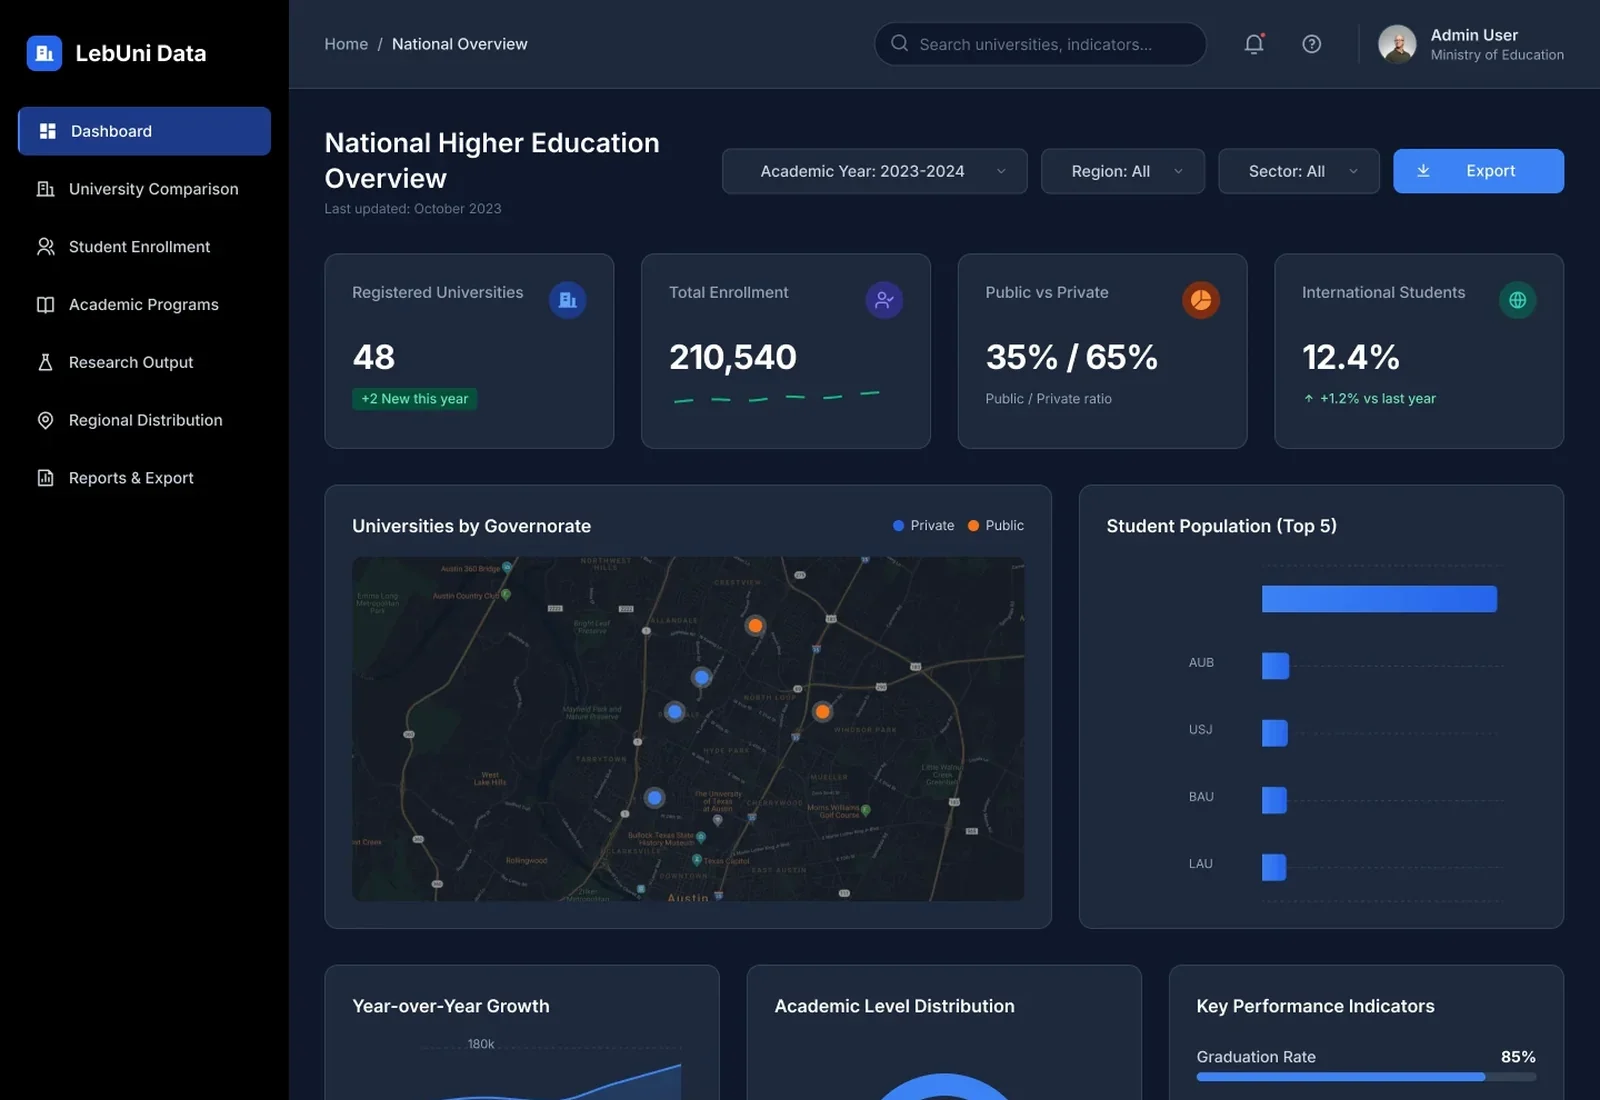
2. One page anatomy, repeated. Every page follows the same structure, so after learning one, you can read them all:
- Breadcrumb, page title and a one-line description of what the page answers.
- Filters (academic year, region, sector, discipline) and a single primary export action.
- Four KPI cards with the headline numbers.
- A main chart paired with a supporting panel.
- A detailed, searchable table at the bottom for the exact figures.
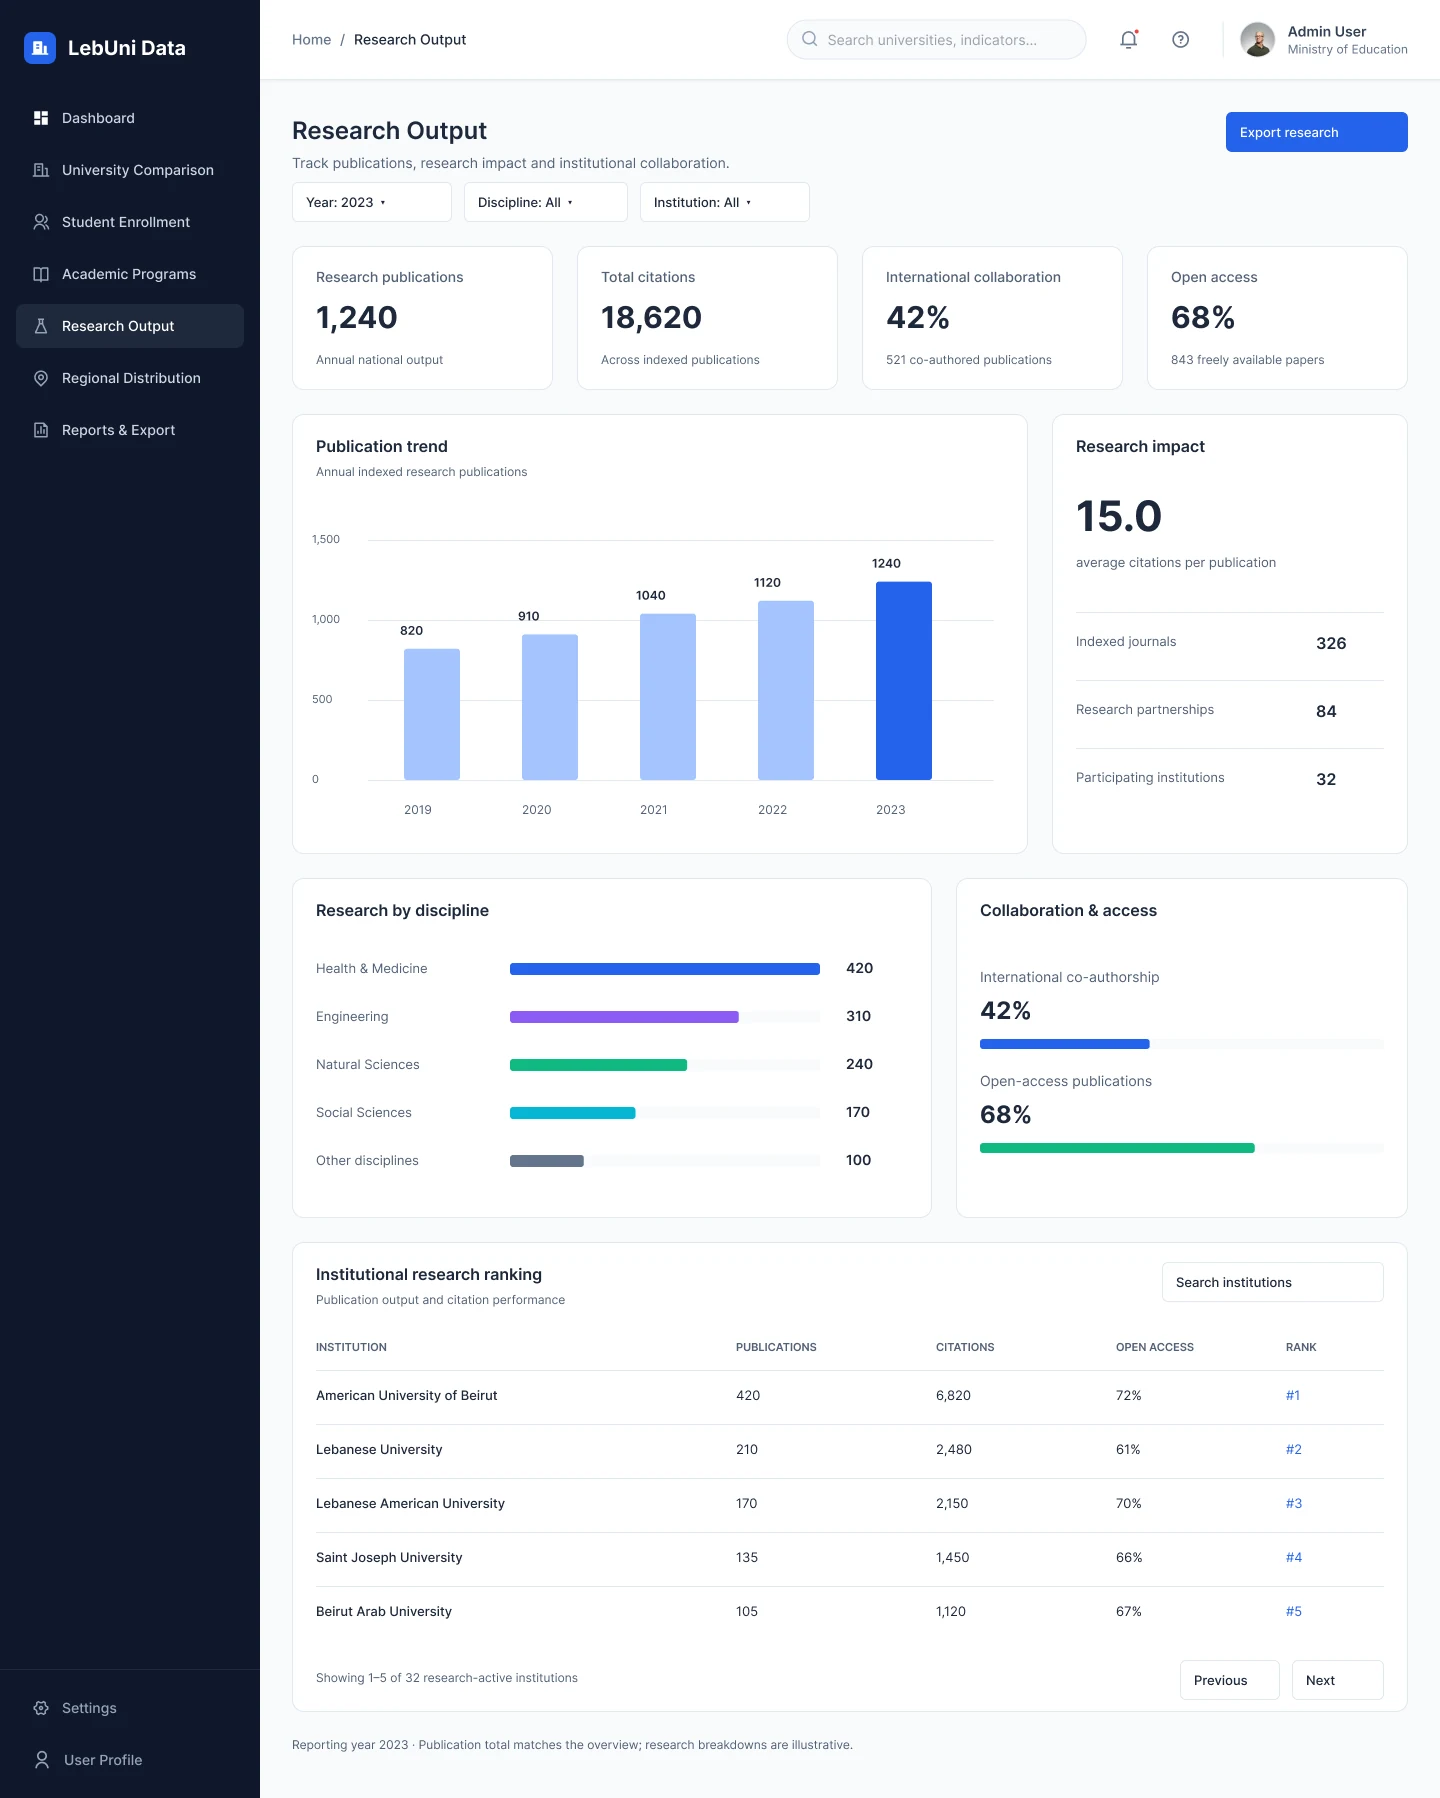
3. Pick the right chart for the job. Ranked horizontal bars for comparisons (enrollment by university, research by discipline), vertical bars for trends over years, a donut only where parts make a whole (academic levels), progress bars for rates, and a map for anything about place.
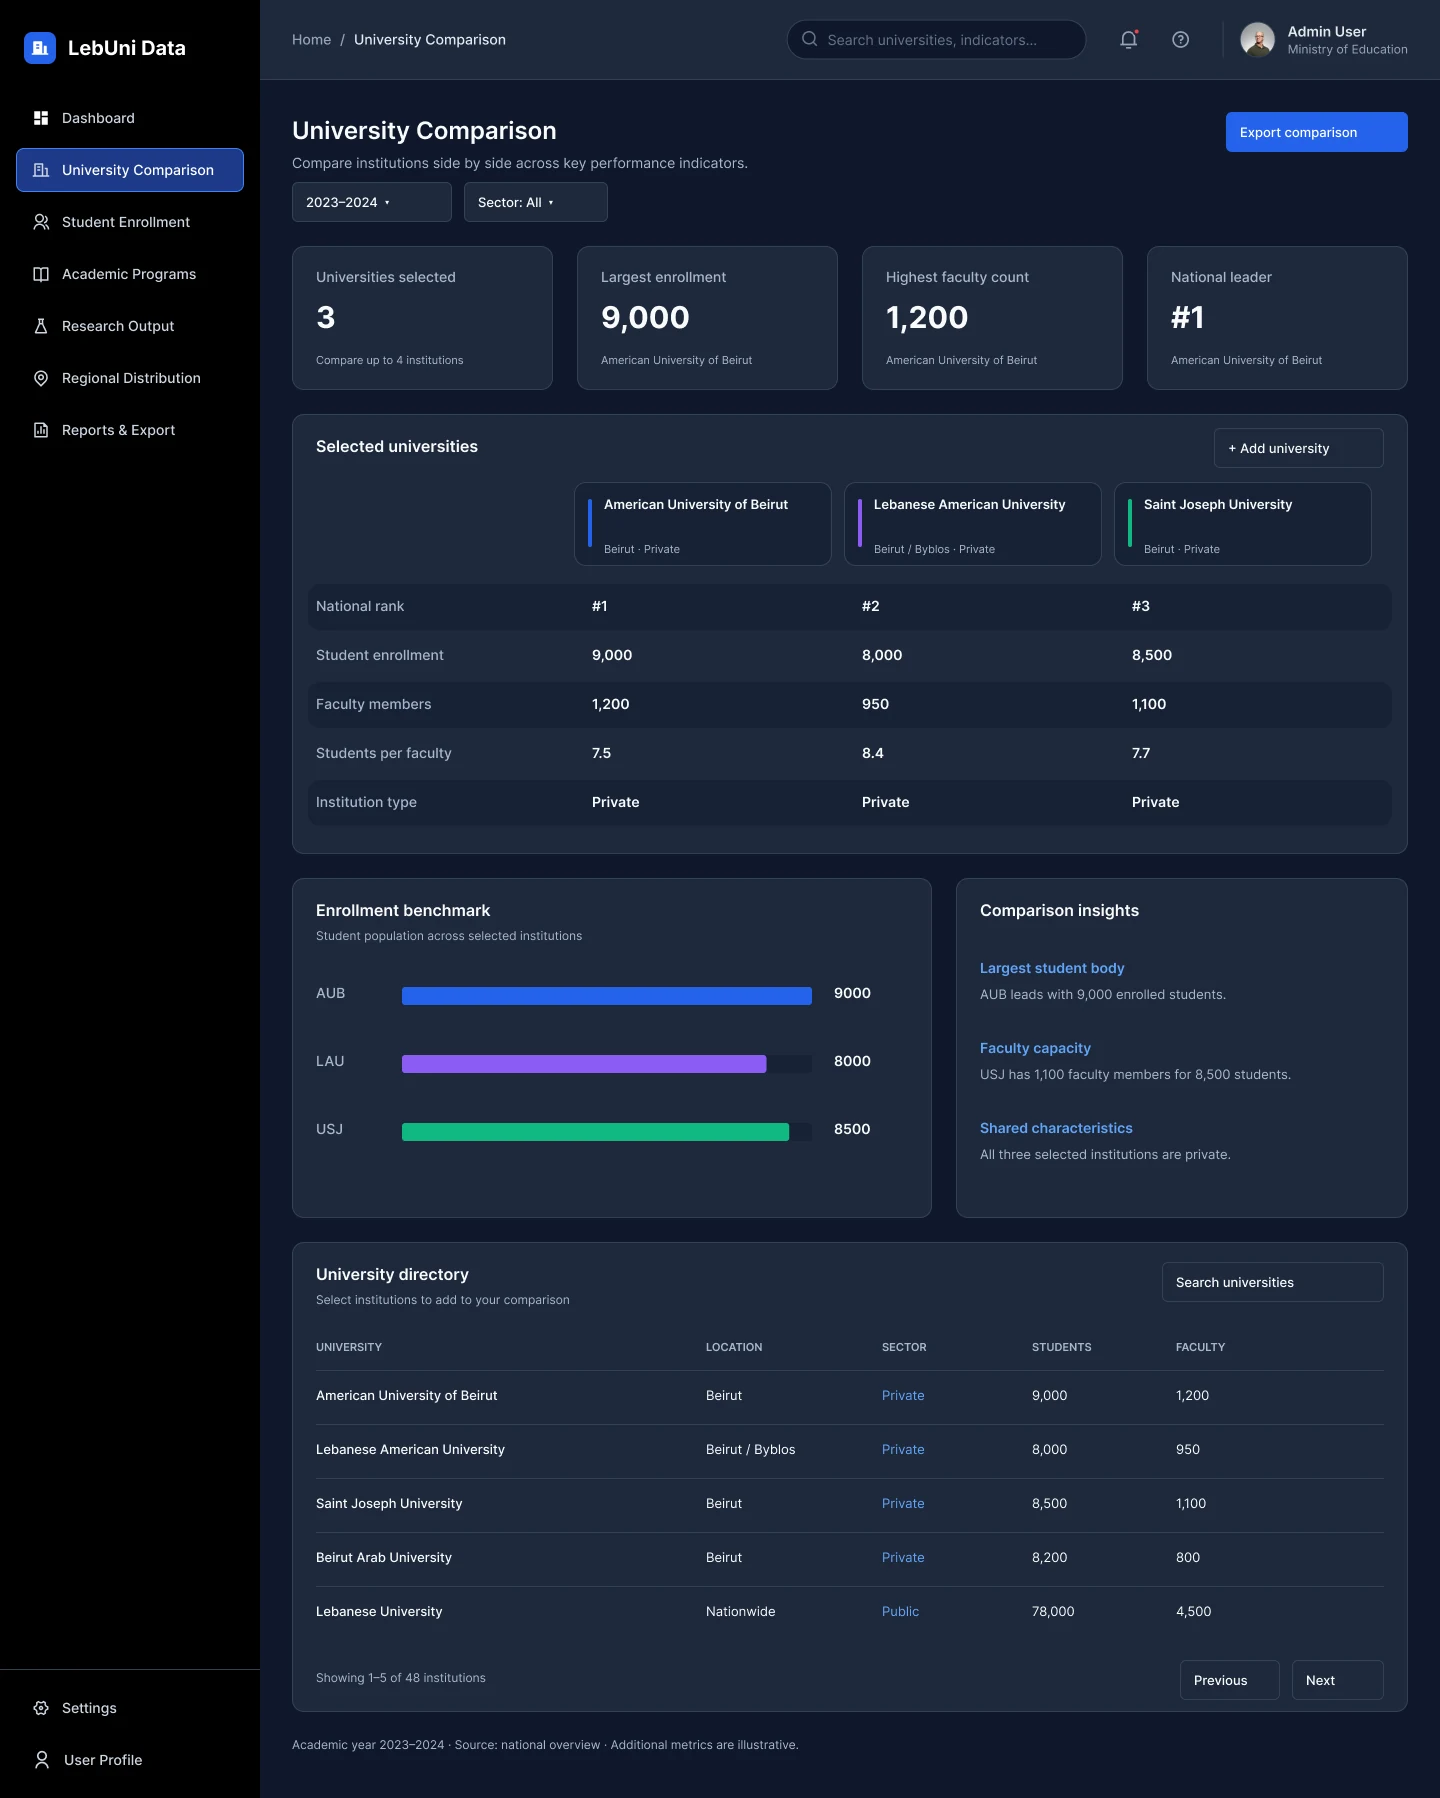
4. Compare without losing context. The University Comparison page lets an analyst pick up to four institutions. Each one gets its own colour that follows it through the side-by-side table and the benchmark chart, and a short "Comparison insights" panel states in plain words what the numbers say.
5. Design both themes at the same time. Dark and light were built together from one set of tokens rather than one being inverted at the end. That kept contrast, chart colours and status badges consistent, so every chart reads the same in either theme.
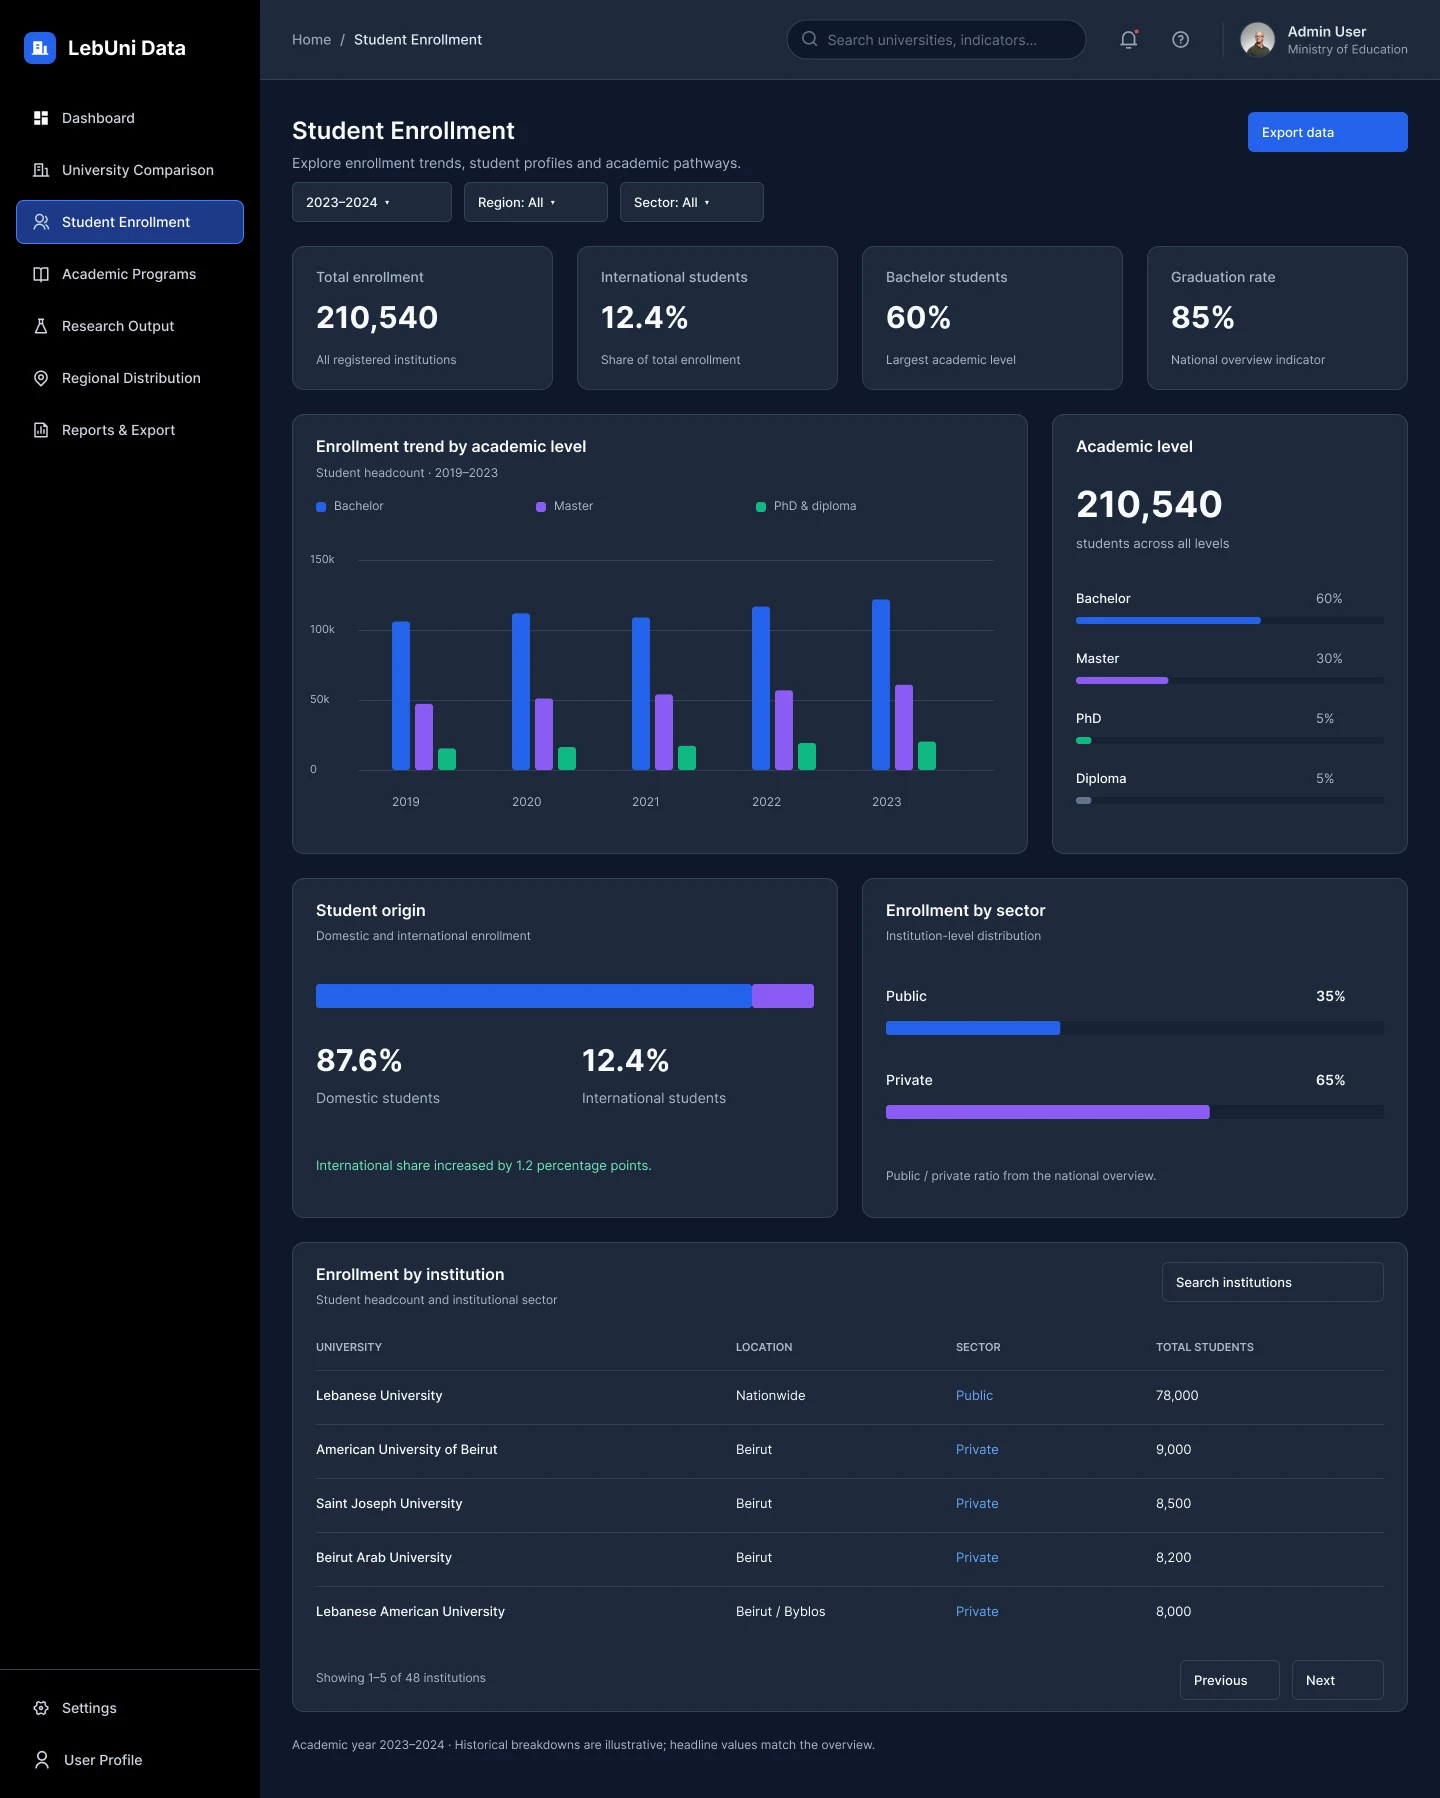
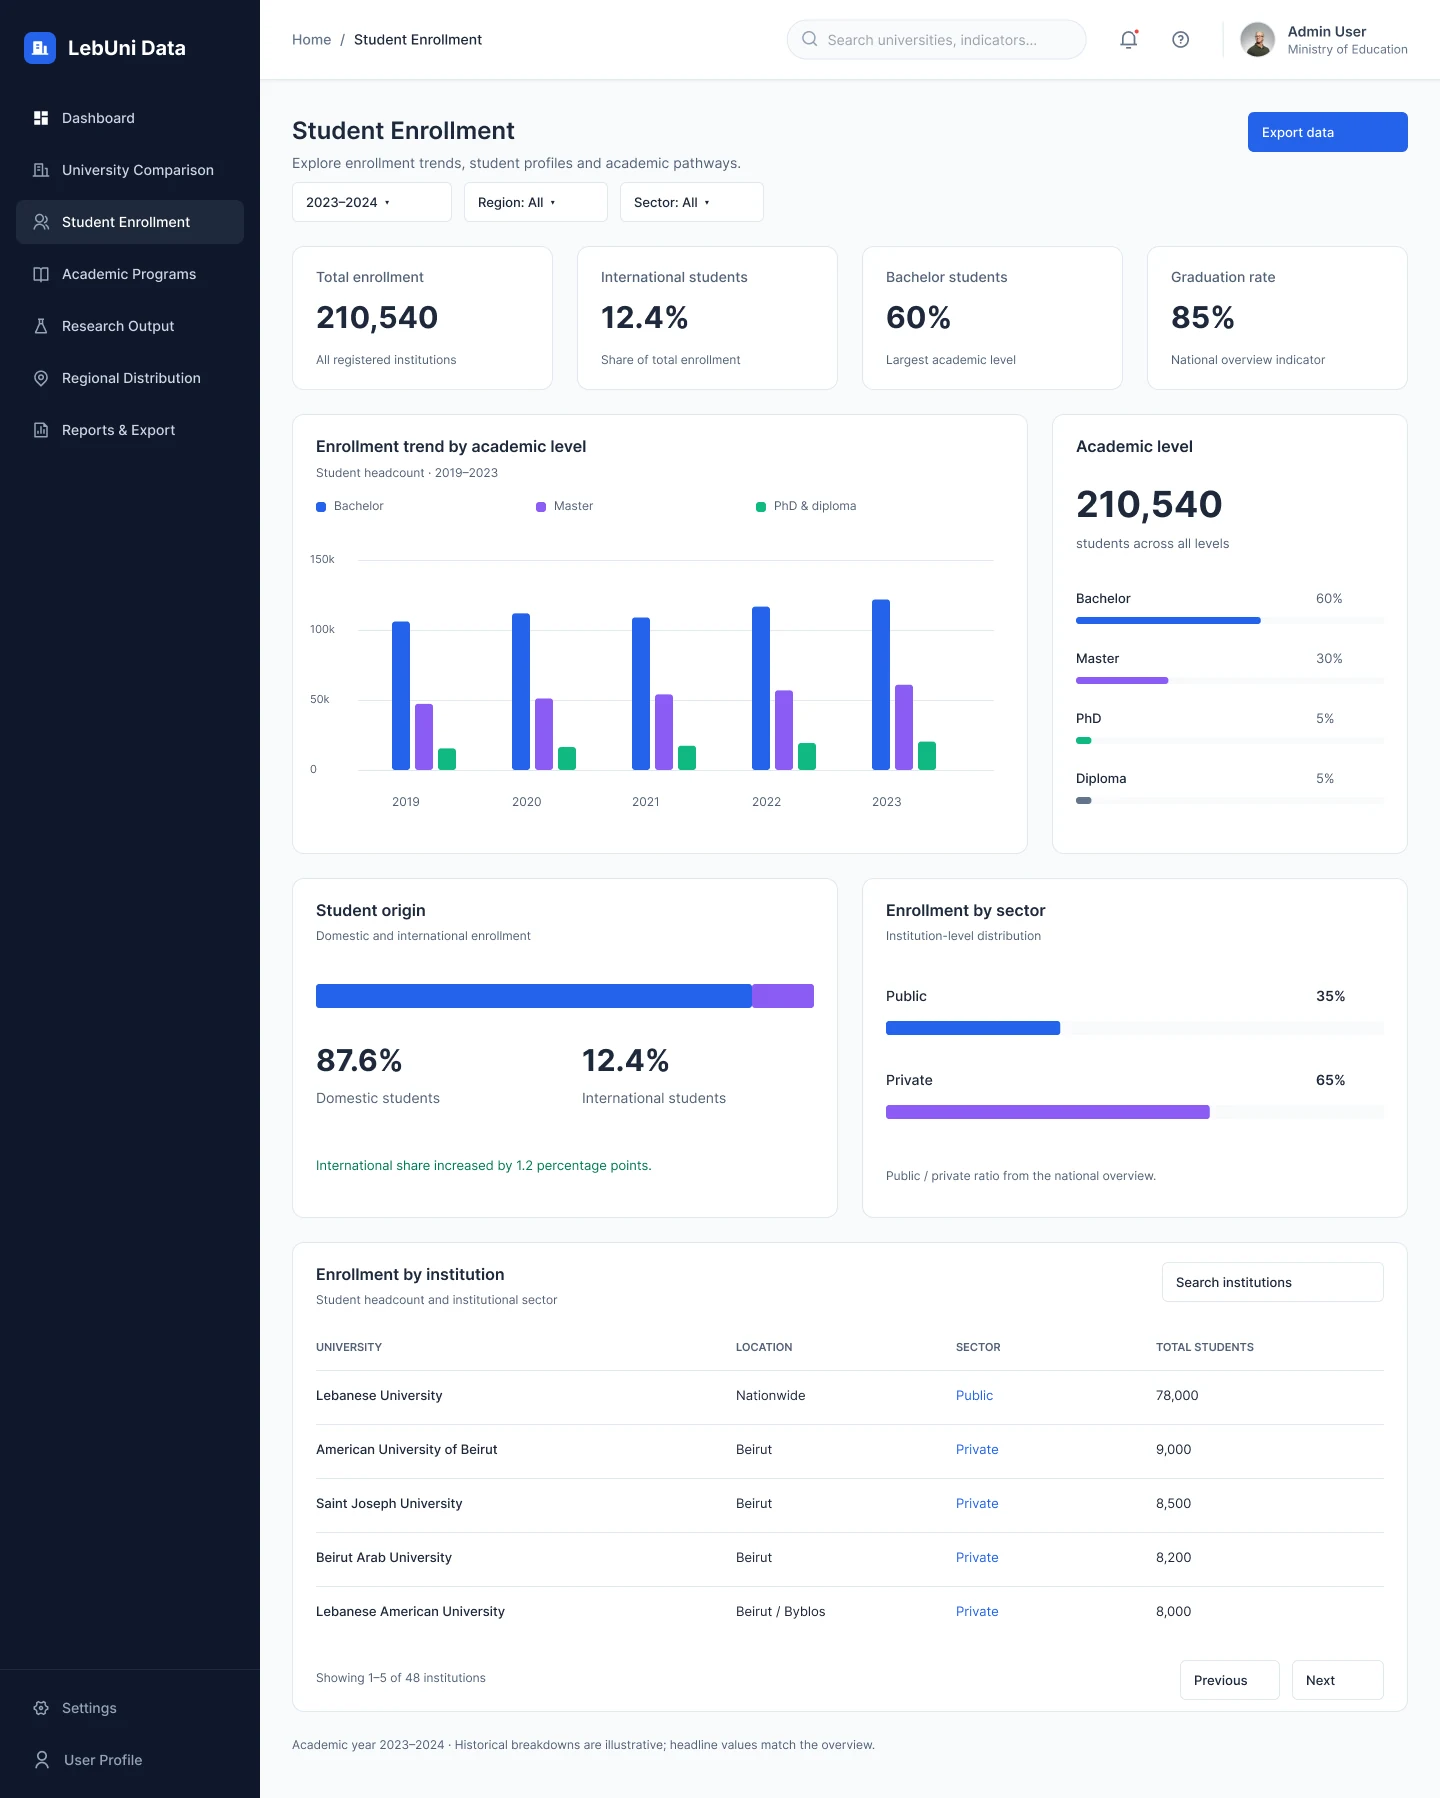
6. Make the data honest. Each page ends with a footnote naming the academic year and source, and marks which figures are illustrative. Totals match across pages: the 48 universities and 210,540 students on the overview are the same numbers on Regional Distribution.
Colour palette
The palette is built on a cool slate scale for surfaces and text, with one strong blue for actions and data. A small set of distinct chart colours is reserved for comparing categories, and orange is kept for public institutions so it never competes with the primary blue.
Brand and data
Primary blue
#2563EB
Actions, active navigation, main data series
Bright blue
#3B82F6
Private institutions, chart highlights on dark
Soft blue
#A5C4FF
Past years in trend charts
Violet
#8B5CF6
Second comparison series
Emerald
#10B981
Third series, positive change
Cyan
#06B6D4
Fourth series, master's degrees
Orange
#F97316
Public institutions
Slate
#64748B
Neutral series, secondary text
Surfaces
Navy
#0F172A
Sidebar; page background in dark
Card dark
#1E293B
Cards and panels in dark
Border dark
#334155
Dividers and outlines in dark
Page light
#F8FAFC
Page background in light
White
#FFFFFF
Cards and panels in light
More screens