CedrusDB UX case study
A database cloud console, from research to final design: problem, personas, journey map, user flows, information architecture, wireframes, UI and usability testing.
- Role
- UX/UI designer
- Year
- 2025
The screens, flows and structure on this page come from the real CedrusDB design. Research findings, personas' quotes, test results and numbers are illustrative examples of how I run each step; they are marked Illustrative and are not data from a real study.
01Project overview
Background
CedrusDB is a managed database service. Its customers are engineering teams who run production data on it, and the web console is where they check health, browse data, run queries, manage access and recover from mistakes. When something breaks, the console is used under pressure, so clarity matters more than anywhere else.
Objectives
- Show cluster health at a glance, with problems explained, not just flagged.
- Make everyday tasks (browse a table, run a query, invite a teammate) quick.
- Make risky actions (restore, delete) safe and deliberate.
- Support long sessions with a calm dark theme and an equal light theme.
Challenges
- Very technical users with strong habits from other database tools.
- Dense data (logs, tables, metrics) that must stay readable.
- Balancing speed for experts with safety for destructive actions.
Project at a glance
- Role
- UX/UI designer
- Platform
- Web console
- Pages
- 7, in dark and light
- Deliverables
- Research, flows, wireframes, UI kit
- Tool
- Figma
02Problem statement
Problem statement
Engineers running production databases need to spot and fix problems fast, but most consoles spread health, data, queries and backups across disconnected screens, and alerts say 'warning' without saying what to do.
Every minute spent hunting for the right page during an incident is downtime. CedrusDB's console has to make the state of the cluster obvious and the next step clear.
How might we…
- …make cluster health understandable in five seconds?
- …turn alerts into clear next steps?
- …make restoring data feel safe instead of scary?
03UX research
Target audience
Backend and DevOps engineers, data analysts who write SQL, and engineering leads who manage access and compliance.
Competitive analysis
Reviewing popular database consoles for navigation, query editors, monitoring and backup flows.
Incident walkthroughs
Engineers describe their last database incident step by step: what they looked at, and in what order.
Task analysis
Listing the top ten console tasks by frequency and by risk.
Key insights
Illustrative findingsINSIGHT 01
Health first, details second
During incidents people want four numbers (latency, CPU, storage, connections) before any chart.
INSIGHT 02
Alerts must explain
A warning without context sends people searching logs.
“Tell me what's wrong and where, not just that it's red.”
INSIGHT 03
Restores are terrifying
Point-in-time recovery is rarely used, so people are unsure and afraid of making things worse.
INSIGHT 04
The editor is home
Analysts spend most of their time in the query editor and expect saved queries and keyboard shortcuts.
04User personas
Alex Morgan
Primary31 · Backend engineer and cluster owner · Remote
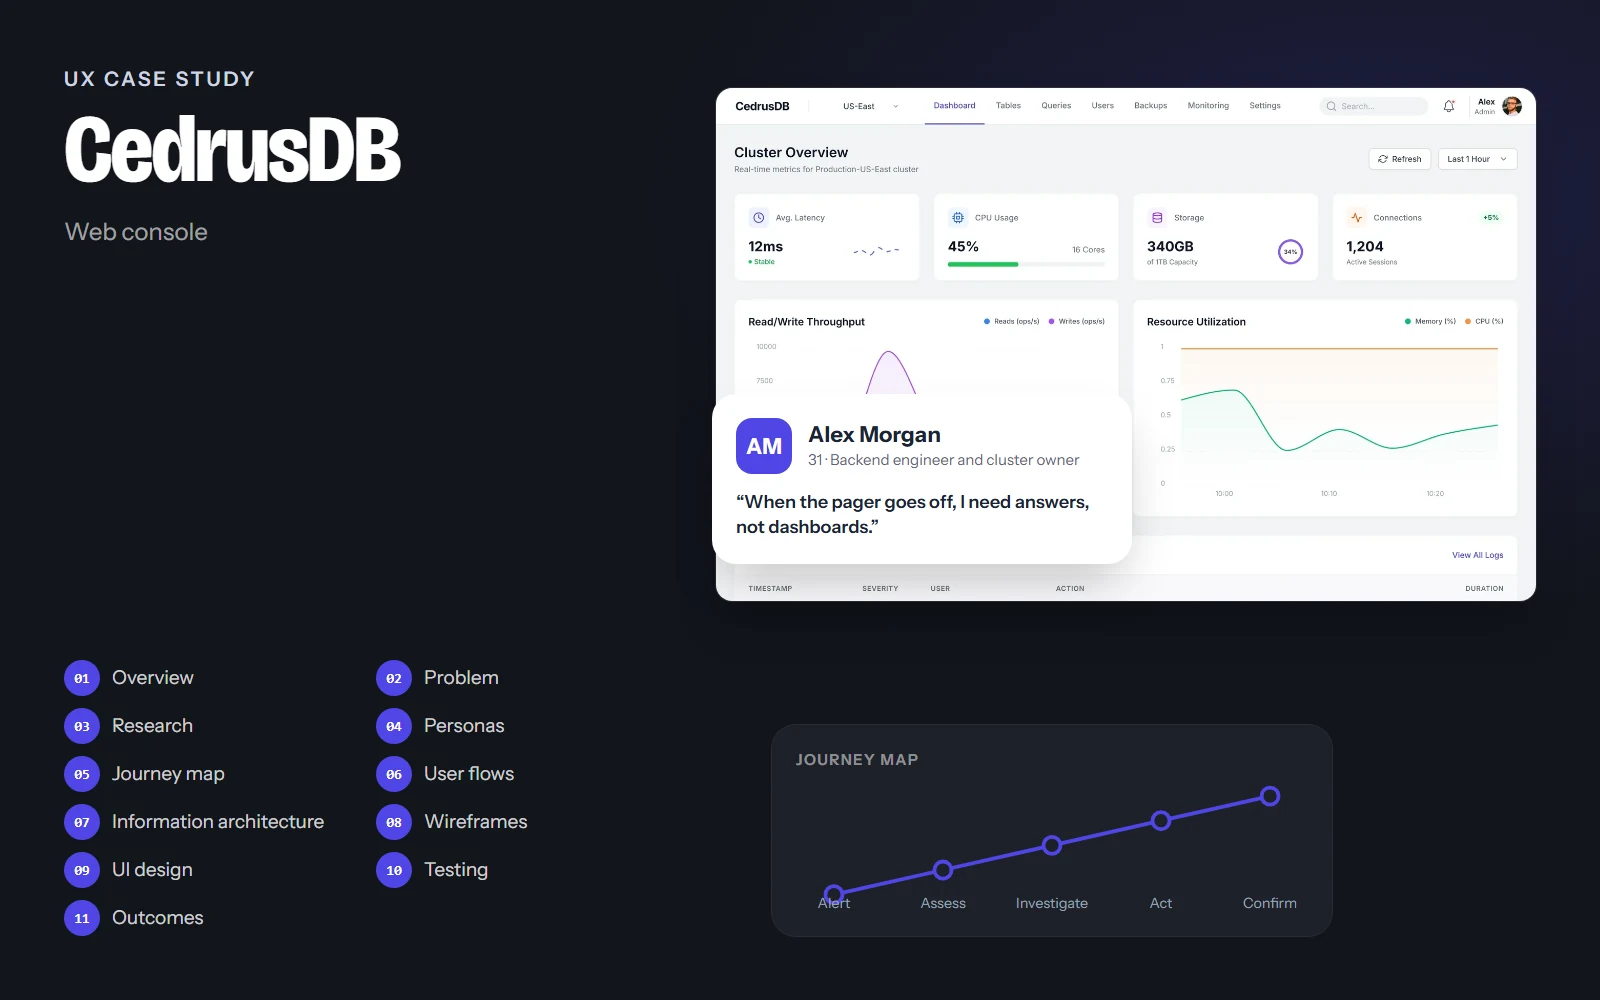
“When the pager goes off, I need answers, not dashboards.”
Alex owns the production cluster. Most days he checks metrics and reviews slow queries; a few times a year he handles an incident at 3 am.
Goals
- See cluster health instantly
- Understand alerts without digging
- Restore data safely when needed
Frustrations
- Vague alerts
- Charts with no thresholds
- Destructive buttons next to safe ones
Habits
- Uses dark mode
- Keyboard shortcuts everywhere
- Copies connection strings often
Sarah Chen
Secondary27 · Data analyst · Remote
“I live in the query editor.”
Sarah writes SQL all day to answer product questions. She has read-only access and wants her saved queries and results close at hand.
Goals
- Run and save queries quickly
- Browse tables and schemas
- Export results
Frustrations
- Losing queries between sessions
- Not knowing if she's on production or a replica
Habits
- Keeps a library of saved queries
- Exports to CSV daily
05User journey map
Alex: a high-memory warning on a replica node during a busy afternoon.
Doing
Gets a notification about high memory usage.
Thinking
“How bad is it, and where?”
Pain point
Alerts that only say 'Warning'.
Opportunity
Alert text with what happened, where, when and the suggested next step.
Select a stage, or a face on the curve, to see what the person is doing, thinking and feeling.
06User flows
The main paths through the product, from the first tap to the goal. Decisions show where the path can branch.
Goal: Go from an alert to a resolved node.
- Alert notification
- Monitoring
- Node health table
- One node?No: check the whole cluster overview
- View alert details
- Scale or tune
- Healthy again
07Information architecture
Dashboard
- Health KPIs
- Throughput
- Resource use
- Operation logs
Tables
- Schema list
- Data
- Schema
- Indexes
Queries
- Saved queries
- SQL editor
- Results
- Execution plan
Users
- Members
- Service accounts
- Roles & permissions
- Access policies
Backups
- History
- Schedule
- Point-in-time recovery
Monitoring
- Cluster health
- Node health
- Alerts
Settings
- General
- Connection
- Security
- Notifications
- Danger zone
A single top navigation with seven sections, the cluster switcher on the left and search on the right. The danger zone sits alone at the end of Settings so destructive actions are never next to everyday ones.
08Wireframes
Low-fidelity layouts came first, to agree on structure and priorities before any colour or type.
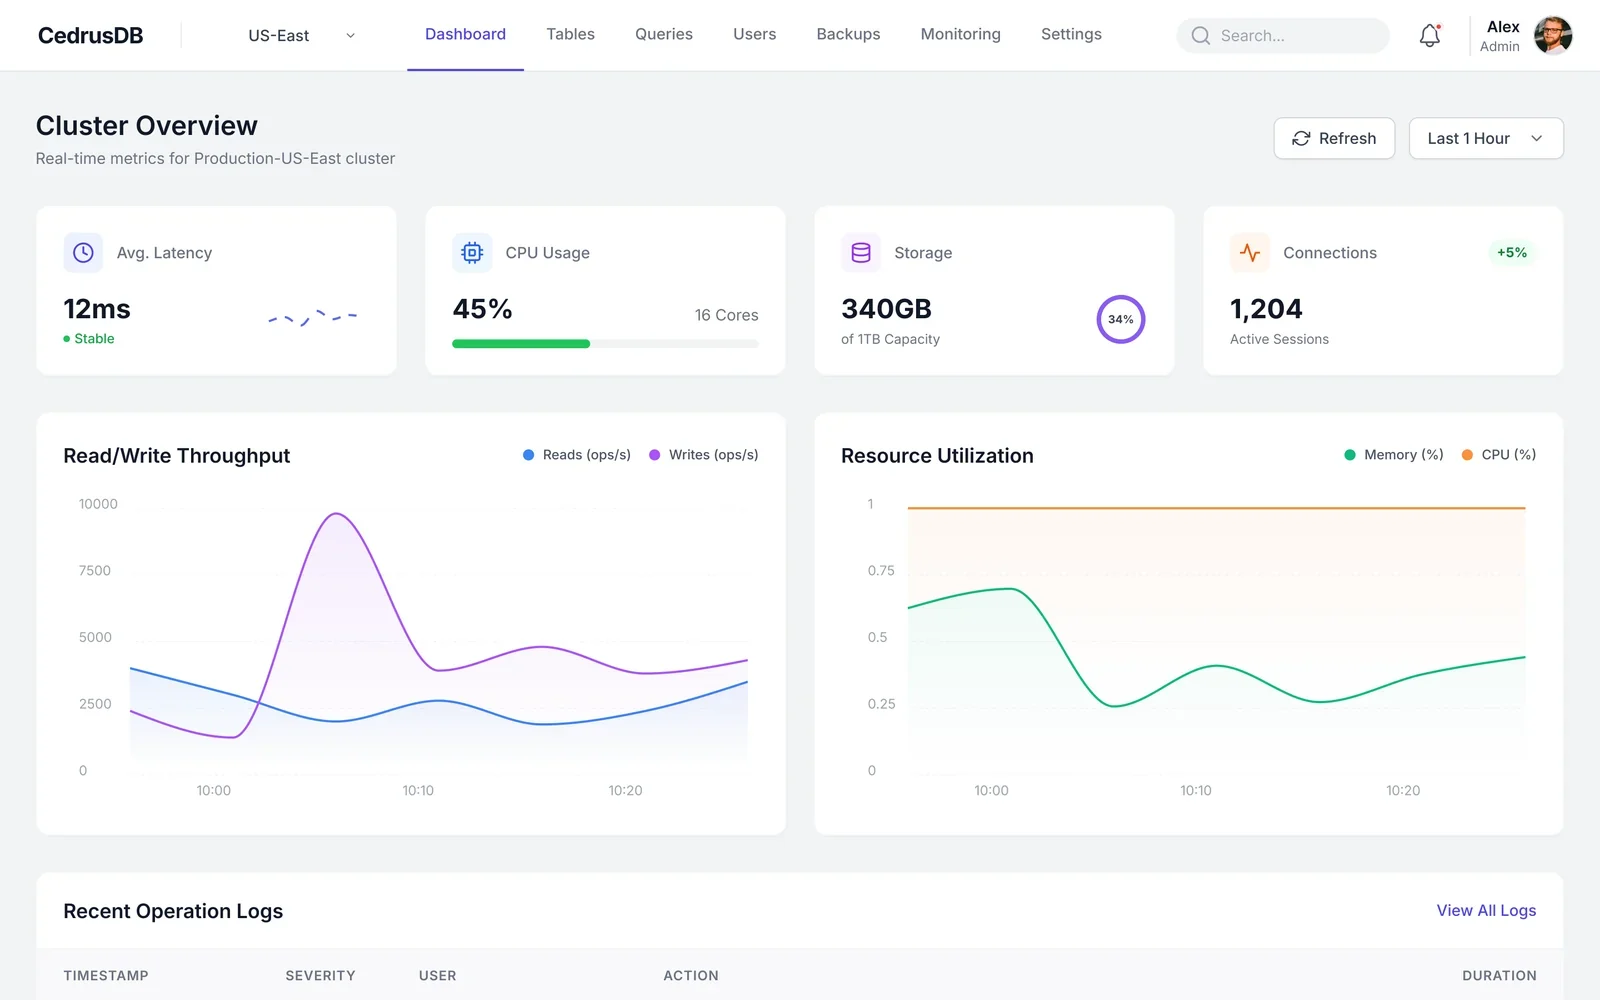
Annotations
- 1Latency, CPU, storage and connections: the four numbers people check first.
- 2Two live charts with consistent series colours.
- 3Latest operations with severity, so issues are visible without opening logs.
Drag across the screen to go from the low-fidelity sketch to the final design.
09UI design
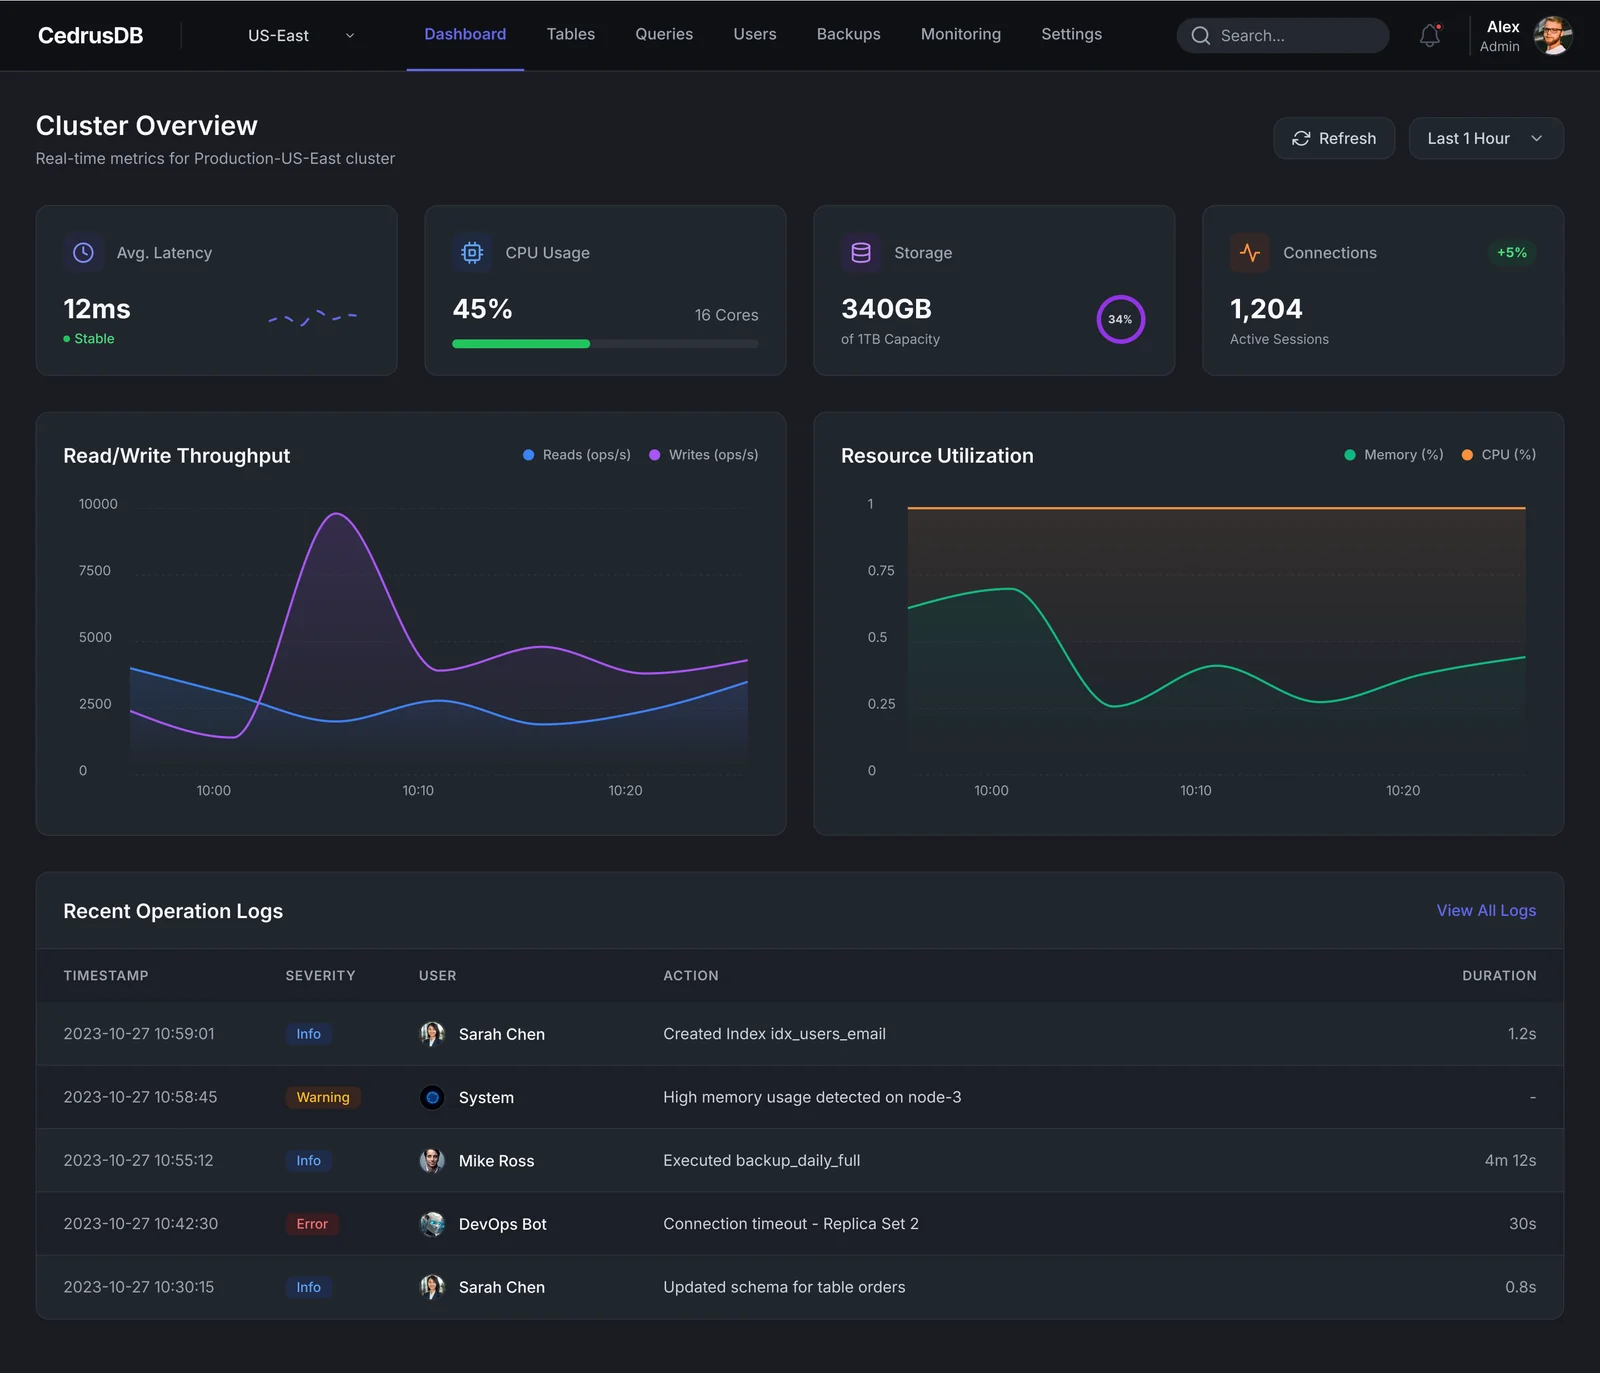
Calm graphite surfaces in dark (cool grays in light), one indigo for actions and the active tab, and a fixed colour per data series. Status colours (green, amber, red) are never used for decoration, and code uses a monospaced face.
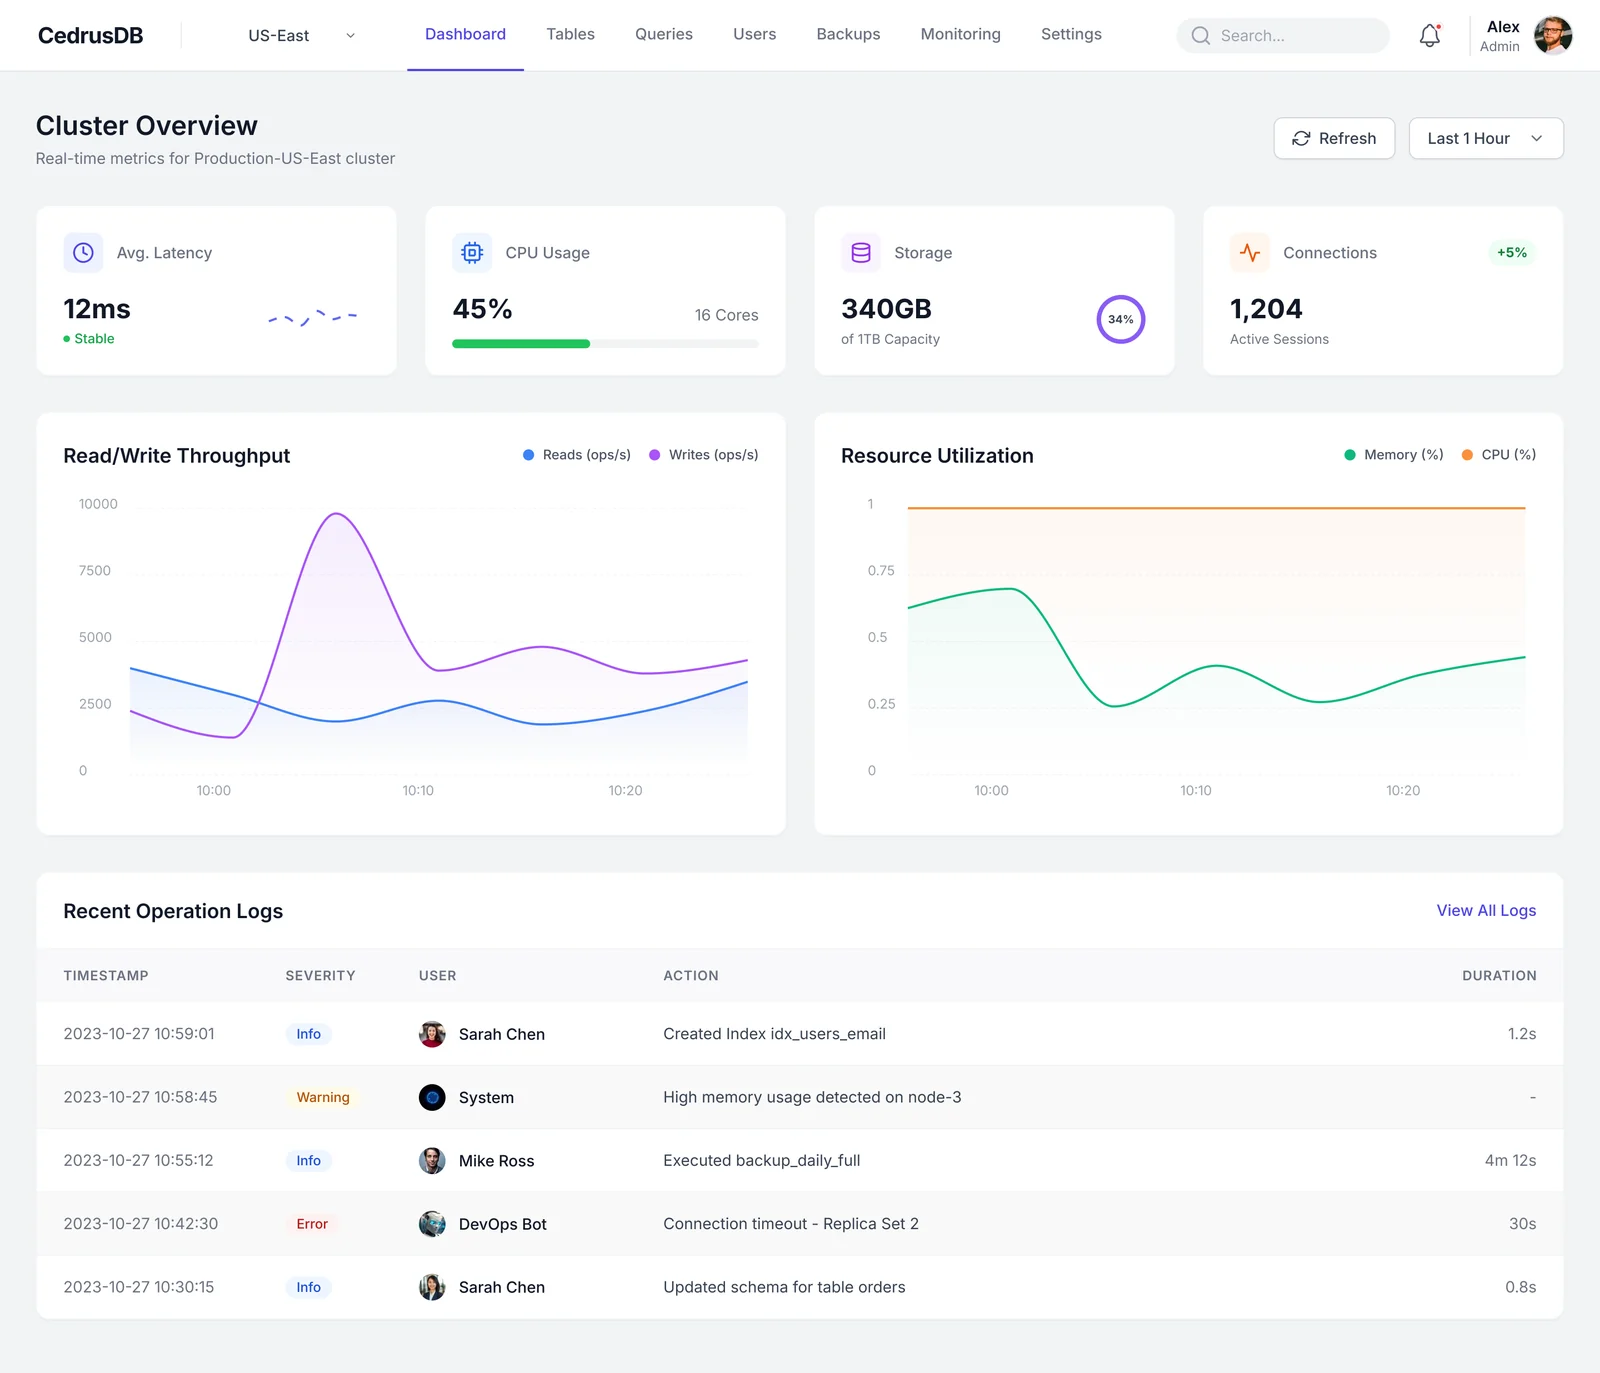
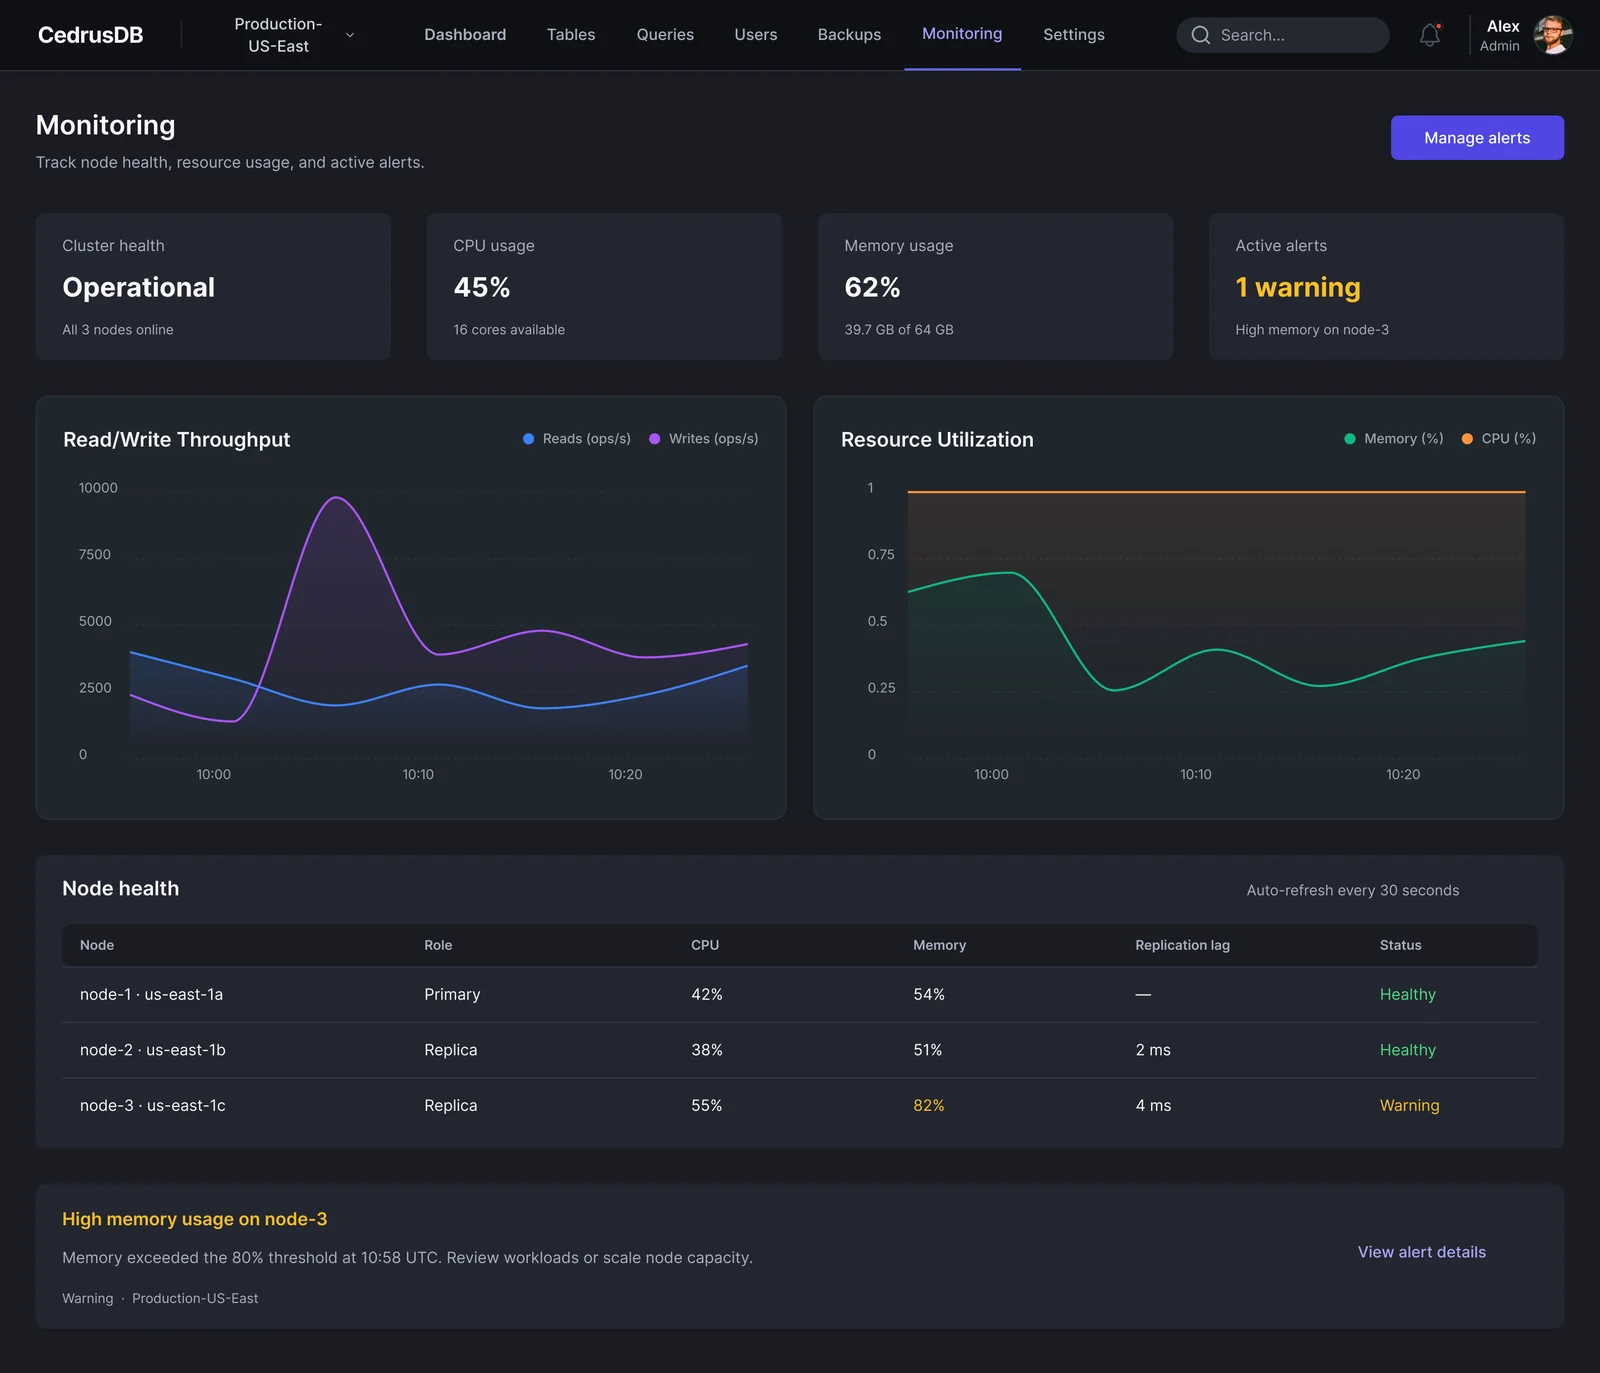
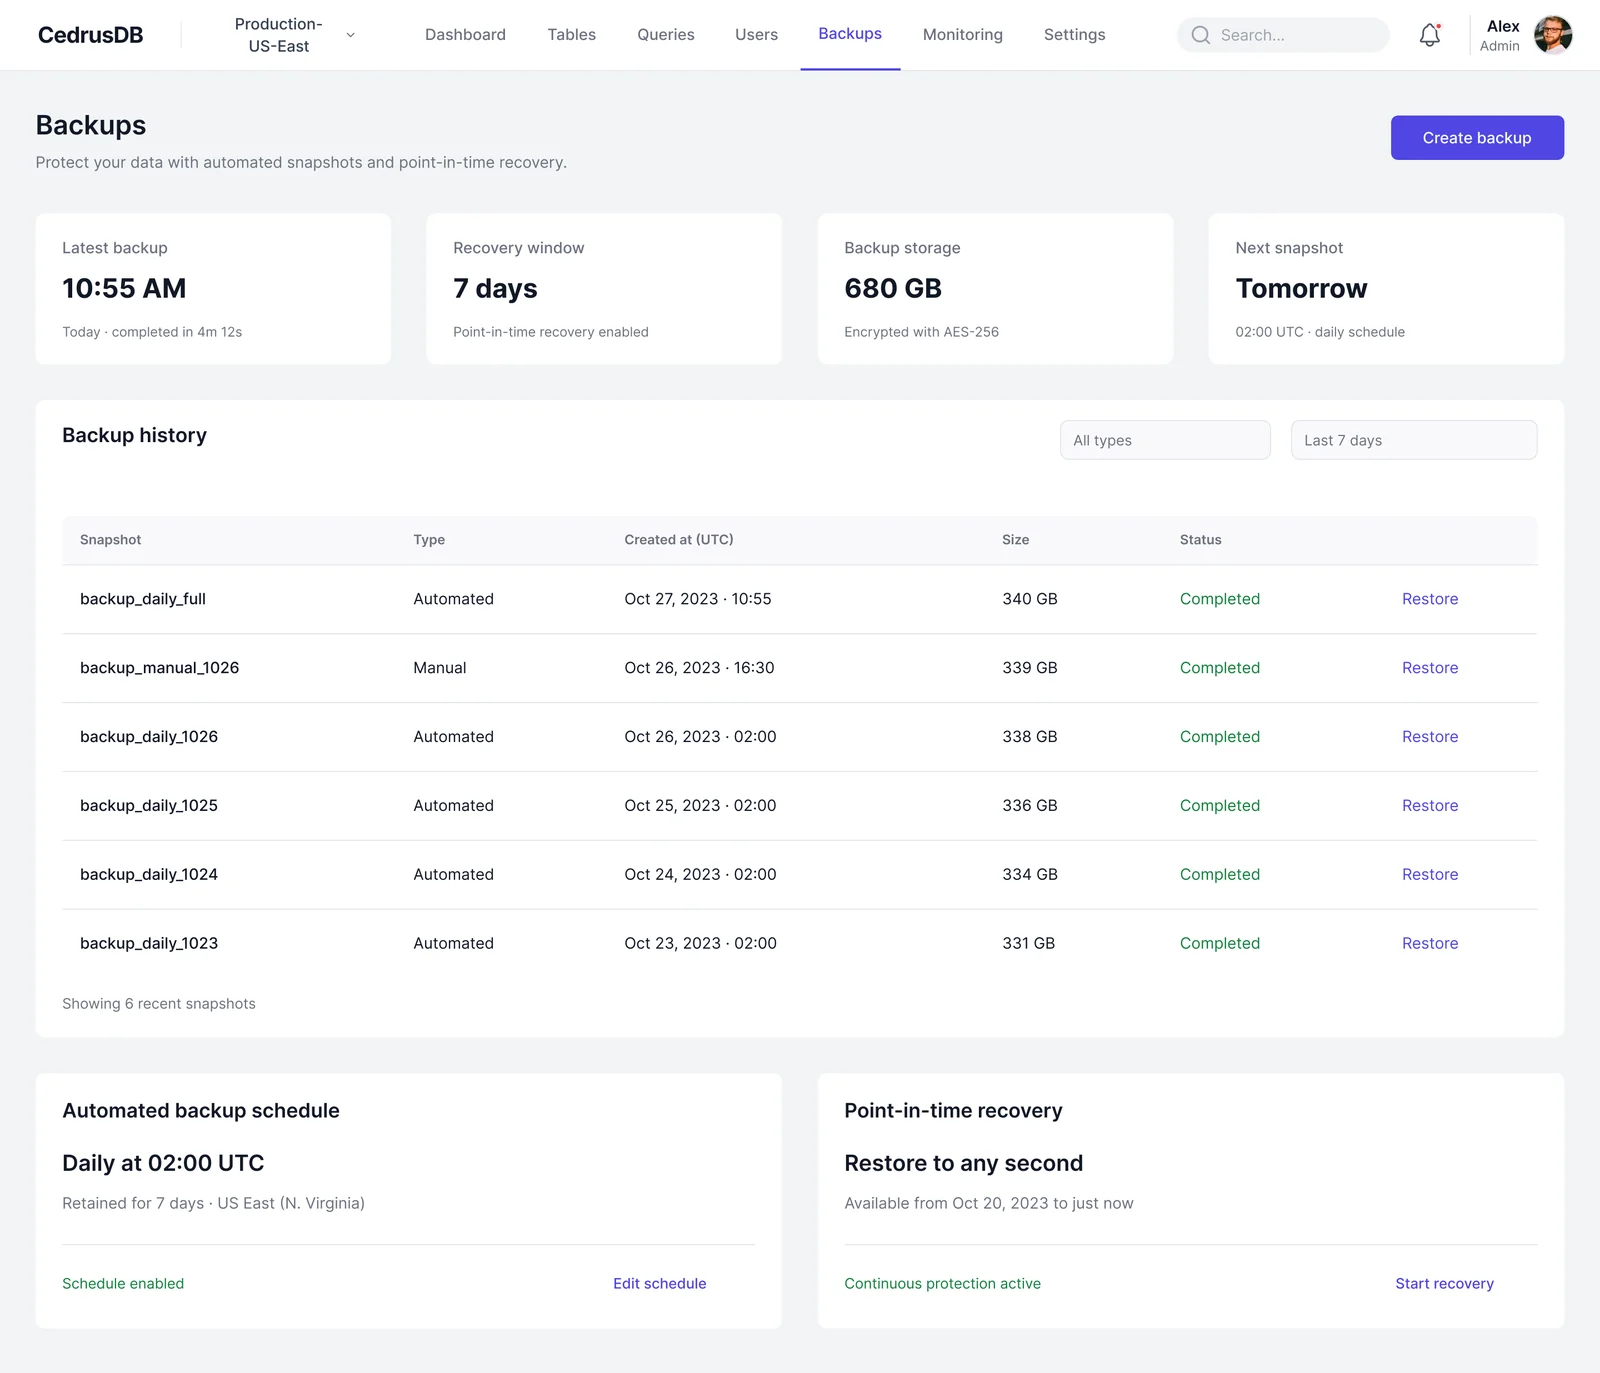
Explain every alert
What happened, where, when and what to do next, in one sentence.
Fixed series colours
Reads are blue, writes violet, memory green and CPU orange on every chart.
Danger lives apart
Destructive actions sit in their own zone and need a typed confirmation.
10Usability testing & iterations
Task success, first round vs. after changes
Illustrative resultsRemote moderated sessions with engineers on a Figma prototype. Numbers below show how a test round would be reported.
Find which node has a problem
Before55%After95%Restore the database to yesterday 2 pm
Before40%After88%Re-run a saved query and export it
Before80%After97%
What we saw
People couldn't tell which node triggered the warning.
What changed
Added a node health table with status per node and a warning banner naming the node.
Why
The first question in an incident is 'where?'.
What we saw
Restore felt risky; people hesitated at the final step.
What changed
Added a restore summary (what, to when, impact) and a typed confirmation.
Why
Deliberate friction makes risky actions feel safe.
What we saw
Analysts weren't sure if they were on production or a replica.
What changed
Showed the connected cluster and 'Read replica' label under the saved queries.
Why
Context prevents running queries in the wrong place.
11Final outcomes
The CedrusDB console makes the state of a production cluster obvious, explains problems in plain words, and turns the scariest task (restoring data) into a calm, guided flow.
4
health numbers at the top of the overview
7
sections in one flat top navigation
1
danger zone, kept apart from everyday settings
Key takeaways
- For tools used under pressure, explaining beats showing.
- Consistent colour per data series is as important as the chart type.
- Good friction is a design tool: it belongs on destructive actions only.
What I would do next
- Test the incident flow with a timed scenario.
- Design query history and team-shared queries.
- Add keyboard command palette for expert users.