LebUni Data UX case study
A national higher-education dashboard, from research to final design: problem, personas, journey map, user flows, information architecture, wireframes, UI and usability testing.
- Role
- UX/UI designer
- Year
- 2025
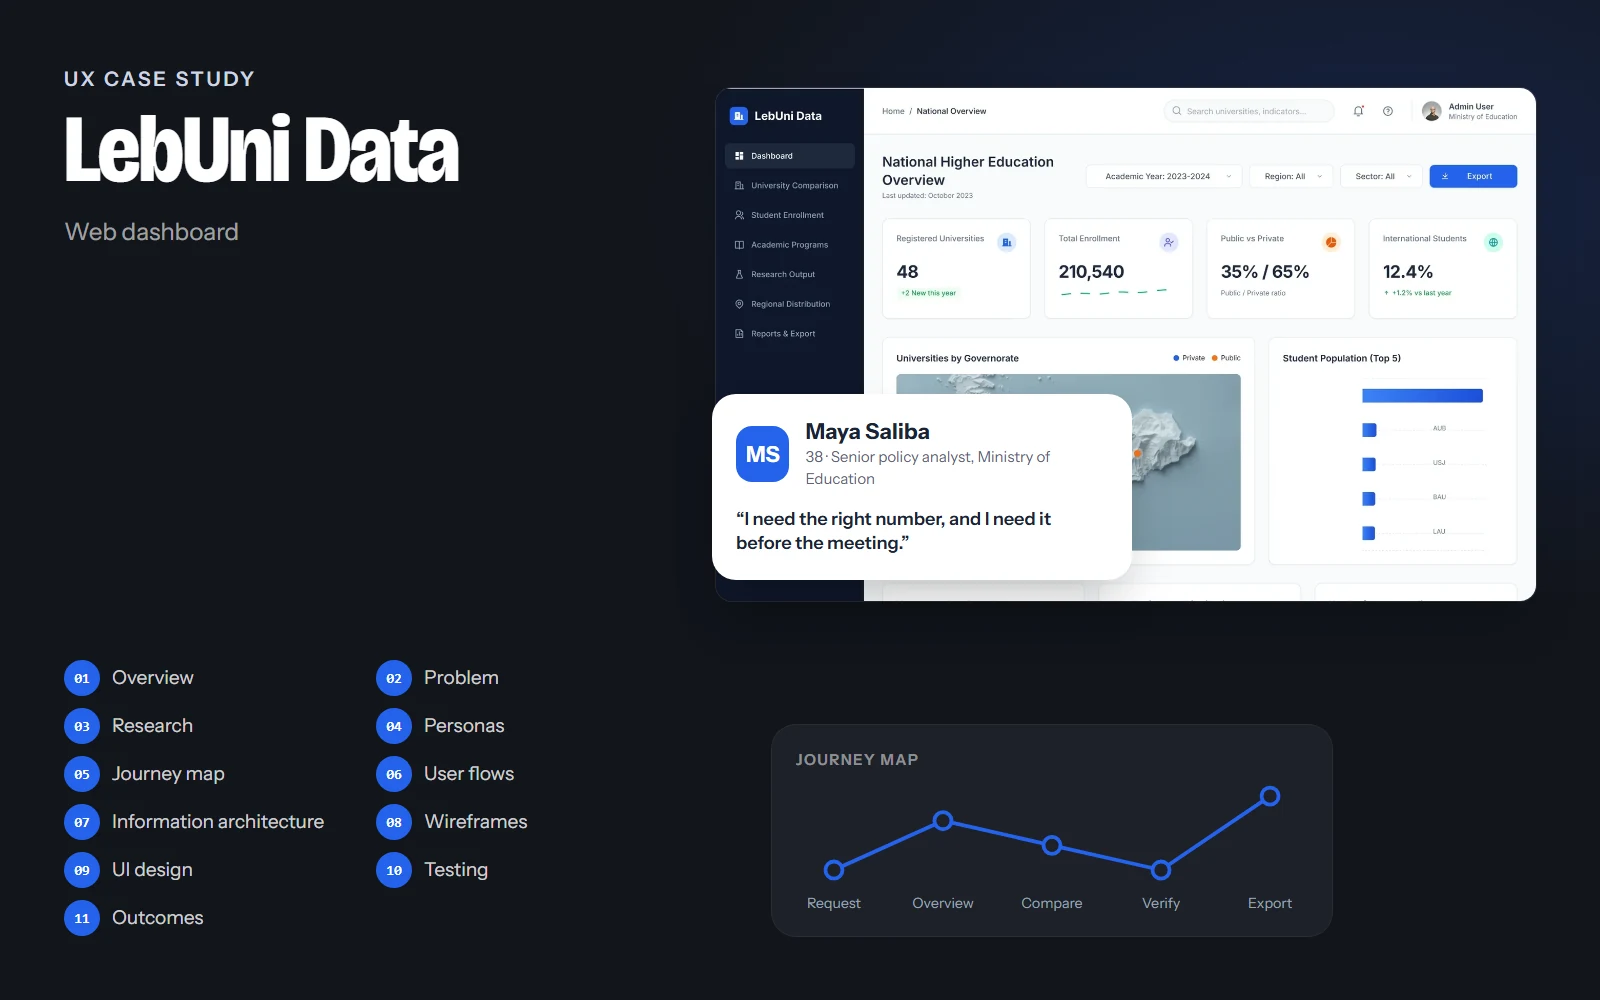
The screens, flows and structure on this page come from the real LebUni Data design. Research findings, personas' quotes, test results and numbers are illustrative examples of how I run each step; they are marked Illustrative and are not data from a real study.
01Project overview
Background
Data about Lebanon's higher-education sector (48 universities, more than 210,000 students, their programs, research and regional spread) sits in separate reports and spreadsheets. Analysts at the Ministry of Education spend more time collecting and reconciling numbers than understanding them. LebUni Data brings that information into one analytics dashboard.
Objectives
- Answer the main questions about the sector without combining spreadsheets.
- Serve both a quick read for a briefing and the exact figures for a report.
- Make comparisons between institutions fair and easy to follow.
- Work equally well in light and dark themes.
Challenges
- Very dense data with many dimensions: year, region, sector, discipline.
- Two different audiences: decision-makers who skim and analysts who dig.
- Keeping totals consistent across seven pages.
Project at a glance
- Role
- UX/UI designer
- Platform
- Web dashboard
- Pages
- 7, in light and dark
- Deliverables
- Research, IA, wireframes, UI
- Tool
- Figma
02Problem statement
Problem statement
Ministry analysts need a reliable national picture of higher education, but the data is split across institutions and formats, so every question means hours of collecting, cleaning and comparing spreadsheets.
When answers take that long, decisions rely on outdated or partial numbers. The dashboard has to make the common questions instant, and the detailed ones possible.
How might we…
- …let someone grasp the national picture in under a minute?
- …compare universities side by side without misleading anyone?
- …keep every number traceable to its year and source?
03UX research
Target audience
Policy analysts, statisticians and directors at the Ministry of Education, plus university planning offices who report data and compare themselves with peers.
Stakeholder interviews
Which questions do analysts get asked most, by whom, and how fast do they need the answer?
Report audit
Reviewing existing annual reports and spreadsheets to list every metric and how it's calculated.
Card sorting
Grouping 40+ metrics into pages that match how analysts think about the sector.
Key insights
Illustrative findingsINSIGHT 01
Questions, not datasets
Analysts think in questions (how many students, where, growing or not), so the navigation should follow those questions.
INSIGHT 02
The table is the truth
Charts help explain, but reports quote exact figures. Every page needs the detailed table underneath.
“The chart is for the minister, the table is for me.”
INSIGHT 03
Comparisons need context
Comparing a 9,000-student university with a 1,000-student one needs ratios, not only totals.
INSIGHT 04
Trust depends on sources
A number without a year and source is not used in official documents.
04User personas
Maya Saliba
Primary38 · Senior policy analyst, Ministry of Education · Beirut
“I need the right number, and I need it before the meeting.”
Maya prepares briefings and annual reports on higher education. She is often asked for figures at short notice and must be sure they're correct.
Goals
- Answer common questions in minutes
- Export exact figures for reports
- Compare institutions fairly
Frustrations
- Numbers that don't match between documents
- Charts without the underlying data
- Rebuilding the same tables every year
Habits
- Works with two screens and Excel
- Exports tables to Word and PowerPoint
- Uses dark mode for long evening sessions
Dr. Fadi Aoun
Secondary55 · Director of planning at a university · Byblos
“I want to see where we stand compared with the others.”
Fadi tracks his university's enrollment and research output and compares them with peer institutions when planning new programs.
Goals
- Benchmark his university against peers
- Spot enrollment trends by discipline
- Share clear charts with the board
Frustrations
- Comparisons that ignore university size
- Dense screens with no clear summary
Habits
- Checks data before each board meeting
- Prefers summaries and clear charts
05User journey map
Maya: preparing a briefing on enrollment growth and the top universities, due the same afternoon.
Doing
Gets a request for national enrollment figures and the top five universities.
Thinking
“Where's the latest data for this?”
Pain point
Data is spread across files from different years.
Opportunity
National Overview opens with the headline numbers for the current year.
Select a stage, or a face on the curve, to see what the person is doing, thinking and feeling.
06User flows
The main paths through the product, from the first tap to the goal. Decisions show where the path can branch.
Goal: Find the total enrollment for the current academic year.
- Open dashboard
- National Overview
- Right year?No: change the academic-year filter
- Read KPI card
- Check source footnote
- Figure ready to quote
07Information architecture
National Overview
- KPIs
- Map by governorate
- Top 5 universities
- Growth
- All universities table
University Comparison
- Select up to 4
- Side-by-side table
- Benchmark chart
- Insights
Student Enrollment
- Trend by level
- Academic levels
- By discipline
- Detailed table
Academic Programs
- Programs by field
- Accreditation
- Program table
Research Output
- Publication trend
- By discipline
- Top institutions
Regional Distribution
- Coverage map
- Enrollment by region
- Regional table
Reports & Export
- Saved reports
- Export formats
- Data sources
Seven pages, one per question analysts are asked. Every page shares the same anatomy: title, filters, four KPIs, a main chart with a supporting panel, then the detailed table.
08Wireframes
Low-fidelity layouts came first, to agree on structure and priorities before any colour or type.
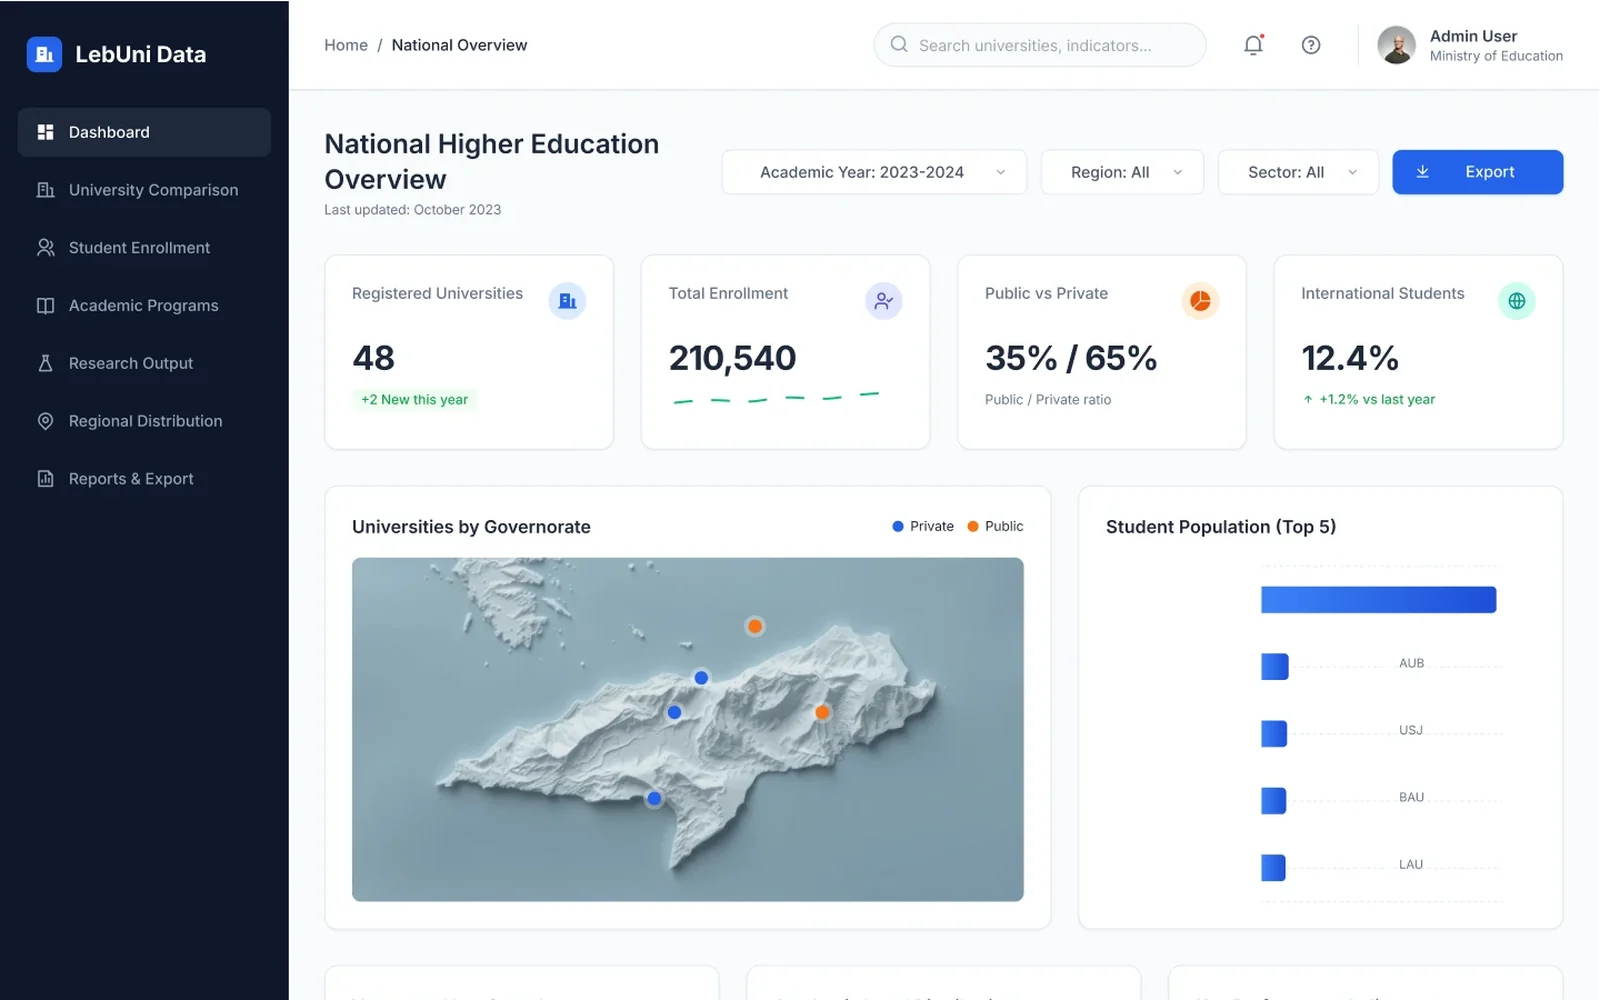
Annotations
- 1Four headline numbers answer the most common questions immediately.
- 2A map for 'where', ranked bars for 'who is biggest'.
- 3Filters for year, region and sector sit next to the title, with one export action.
Drag across the screen to go from the low-fidelity sketch to the final design.
09UI design
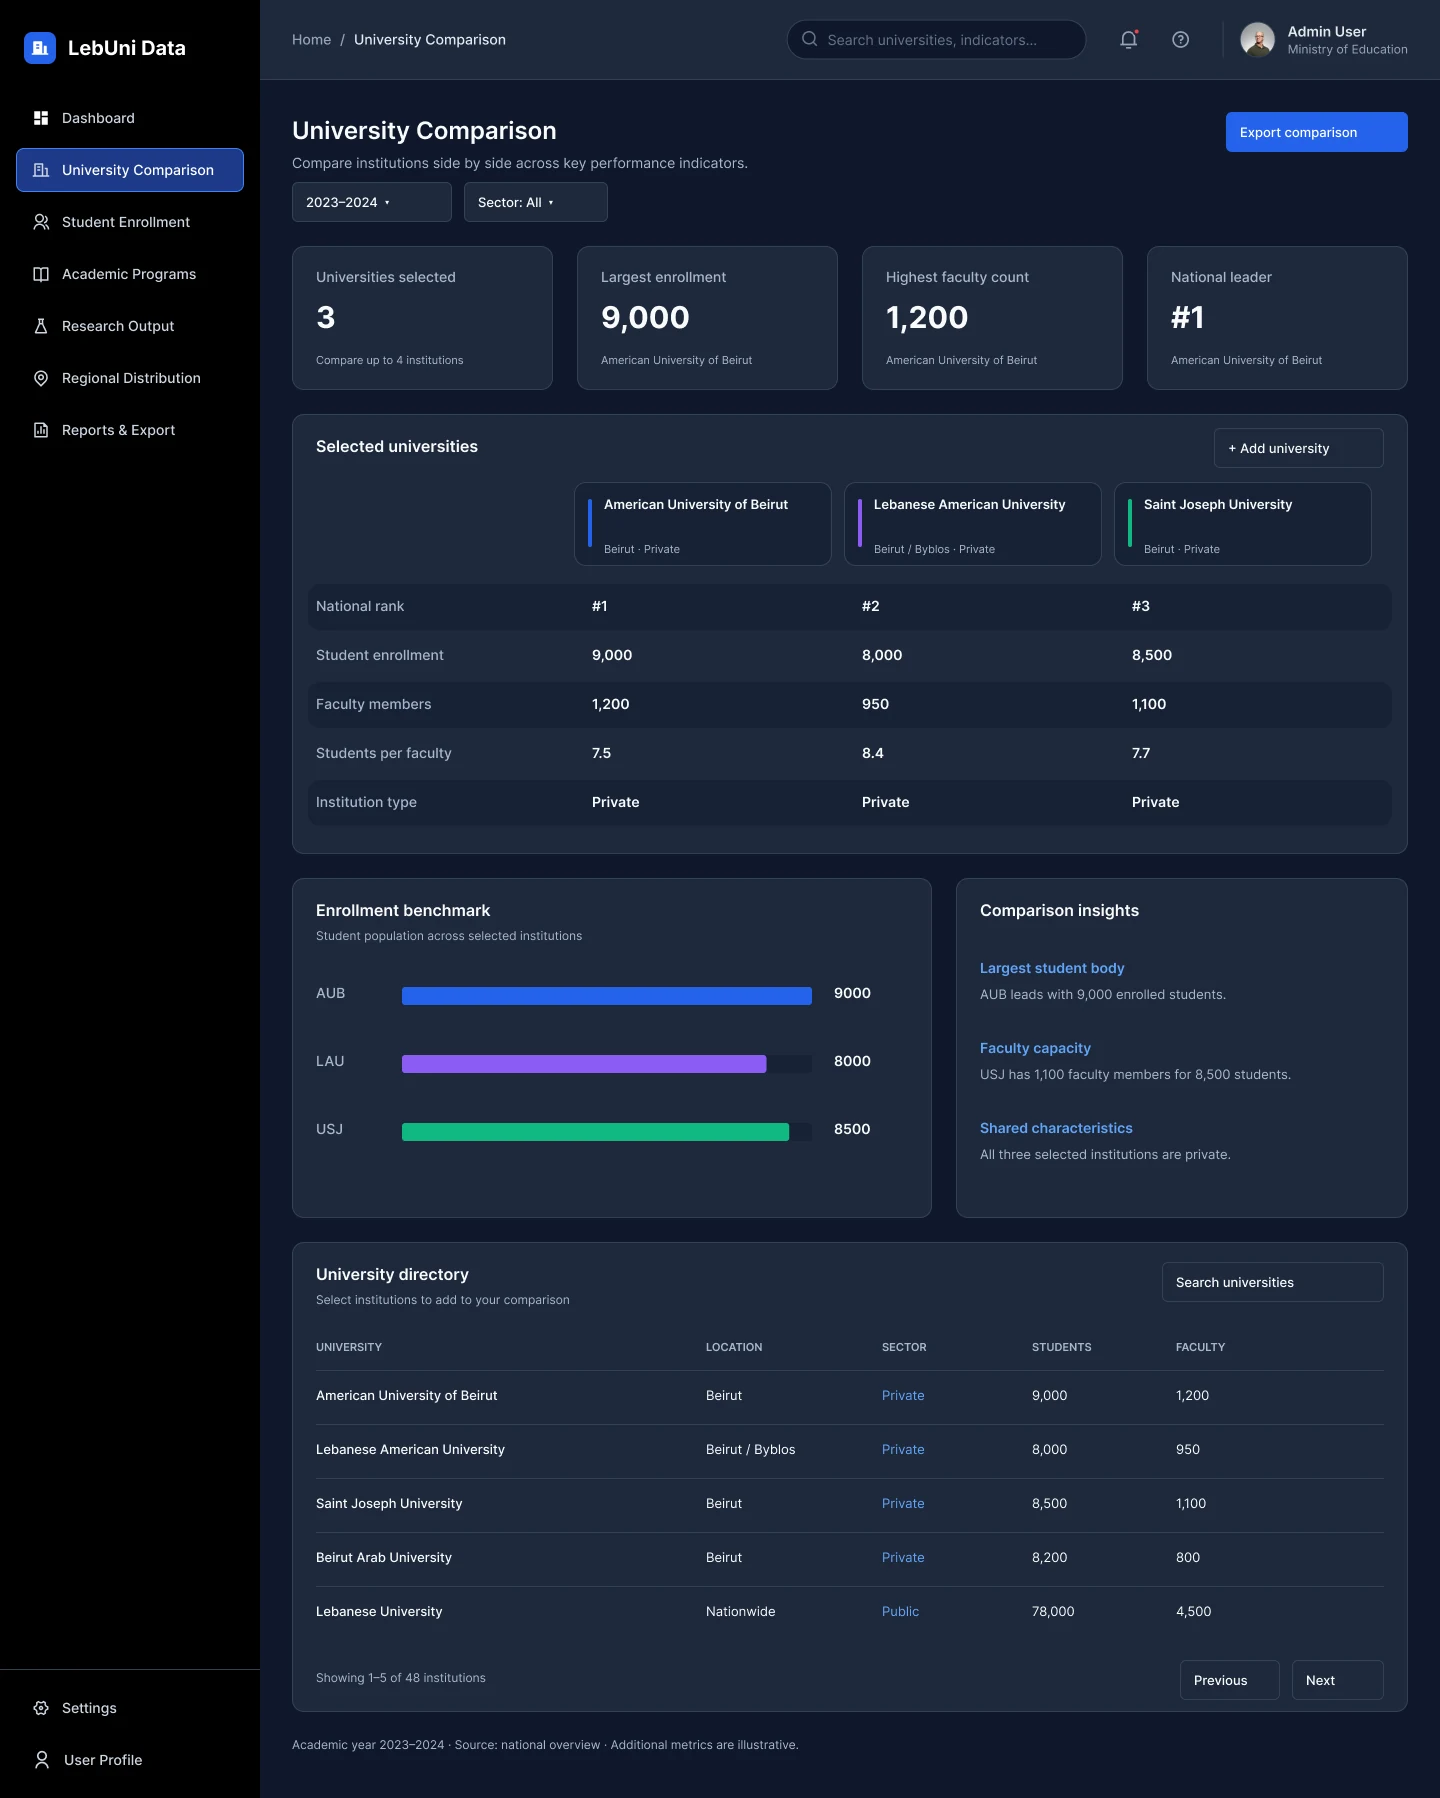
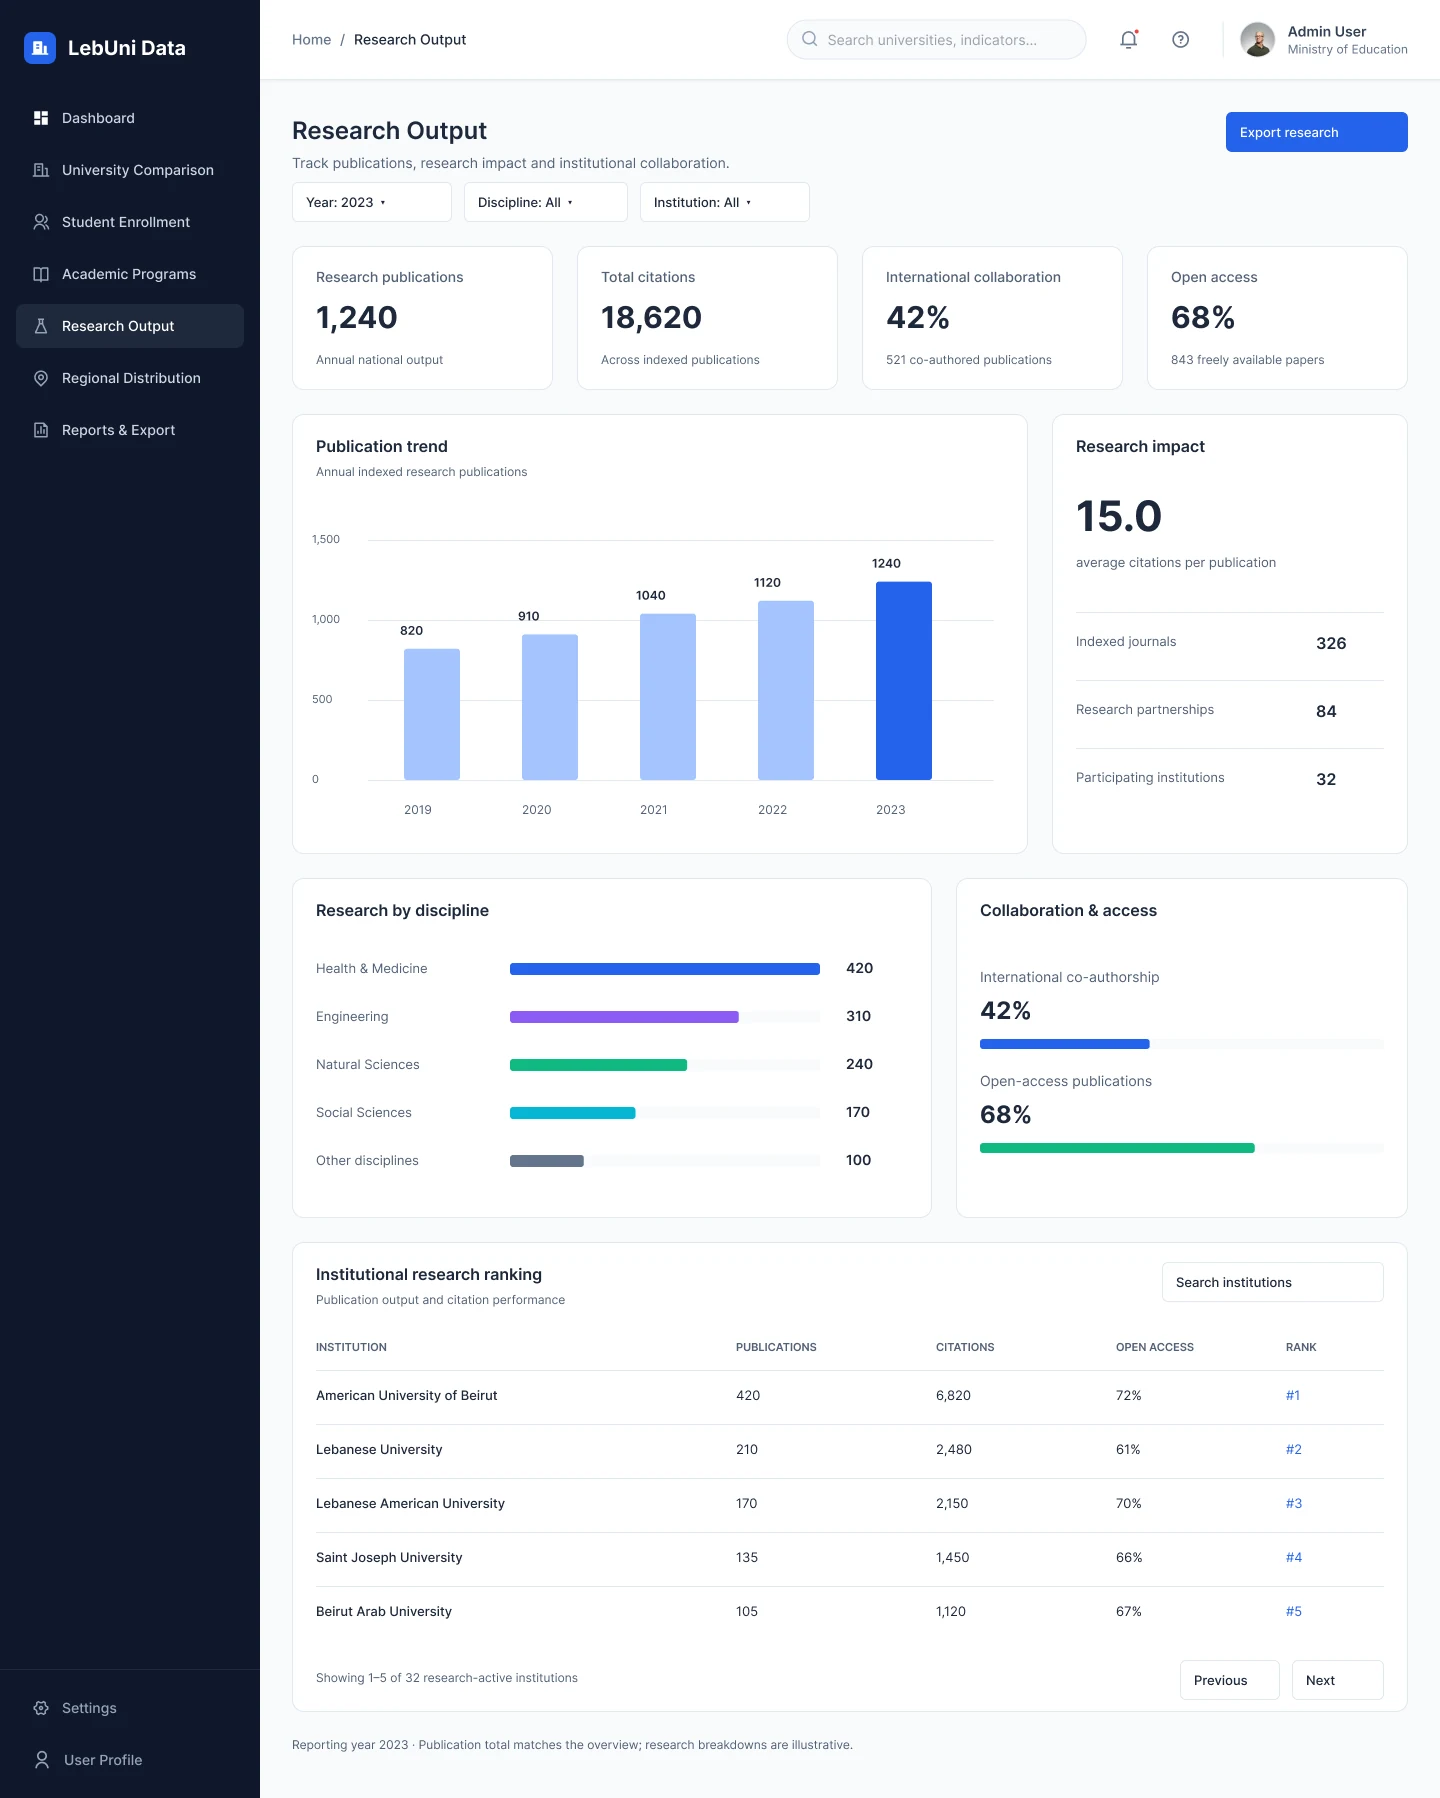
A cool slate scale for surfaces and text, one strong blue for actions and data, and a small set of distinct chart colours reserved for comparisons. The dark navy sidebar stays the same in both themes so the product is always recognisable.
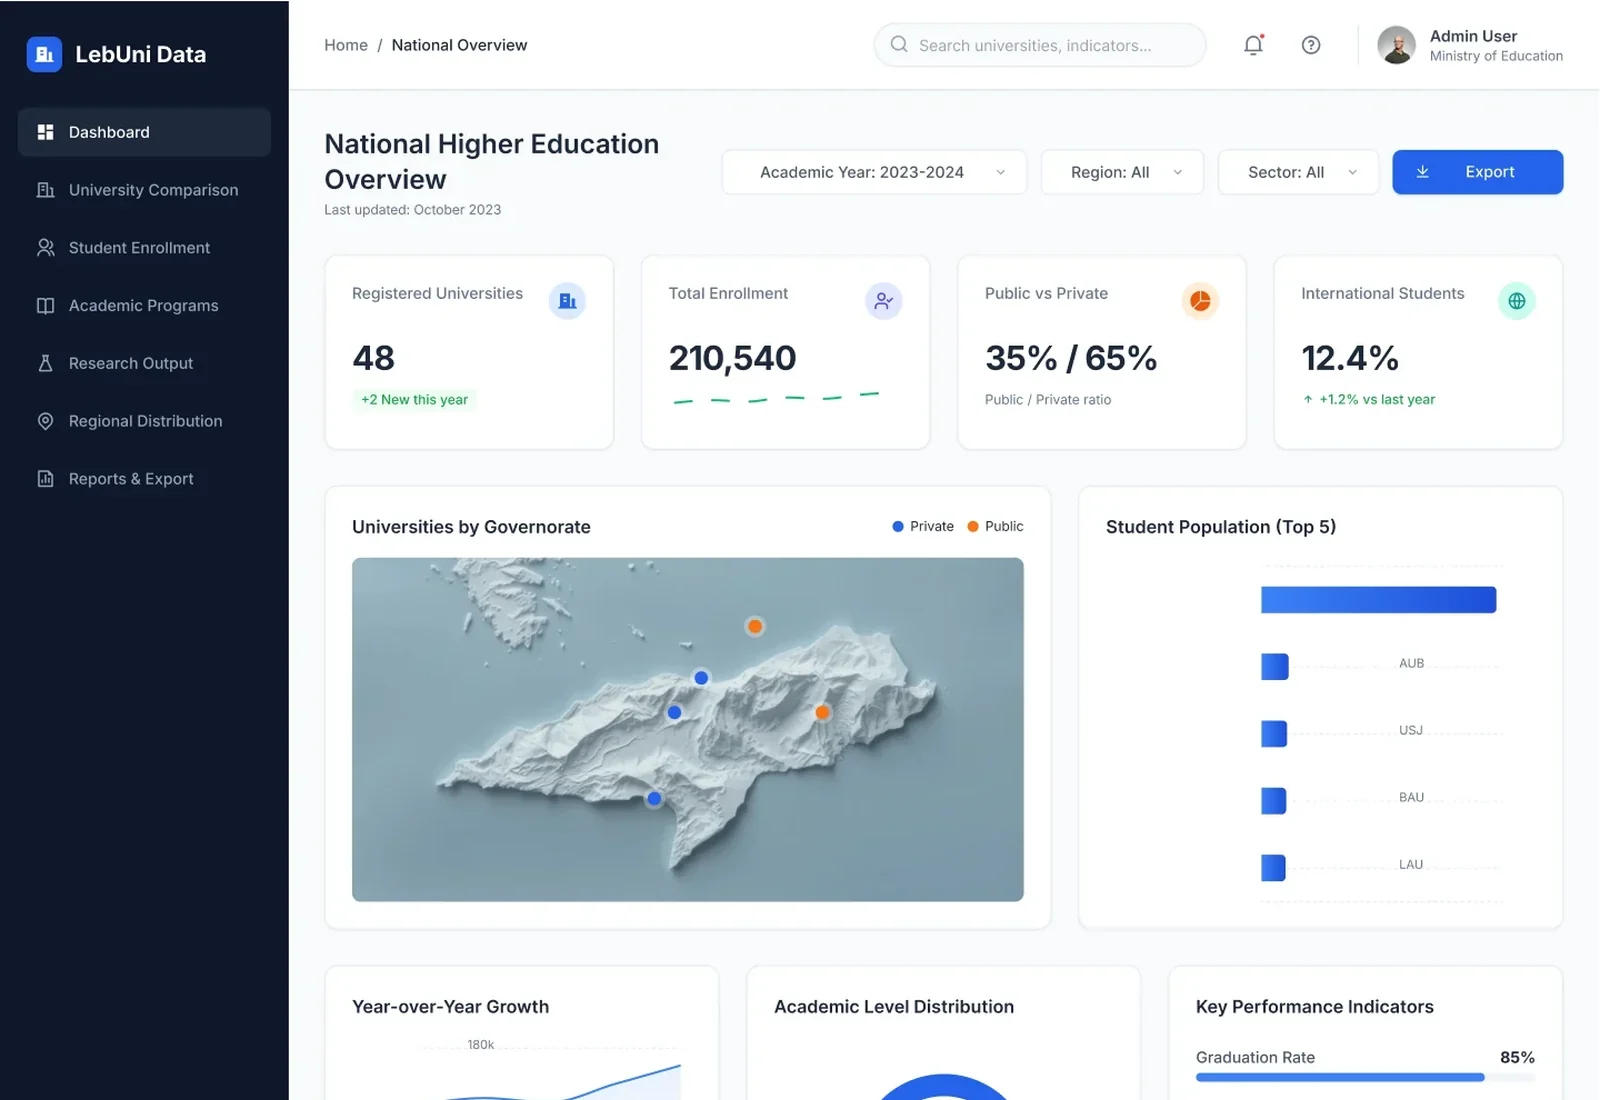
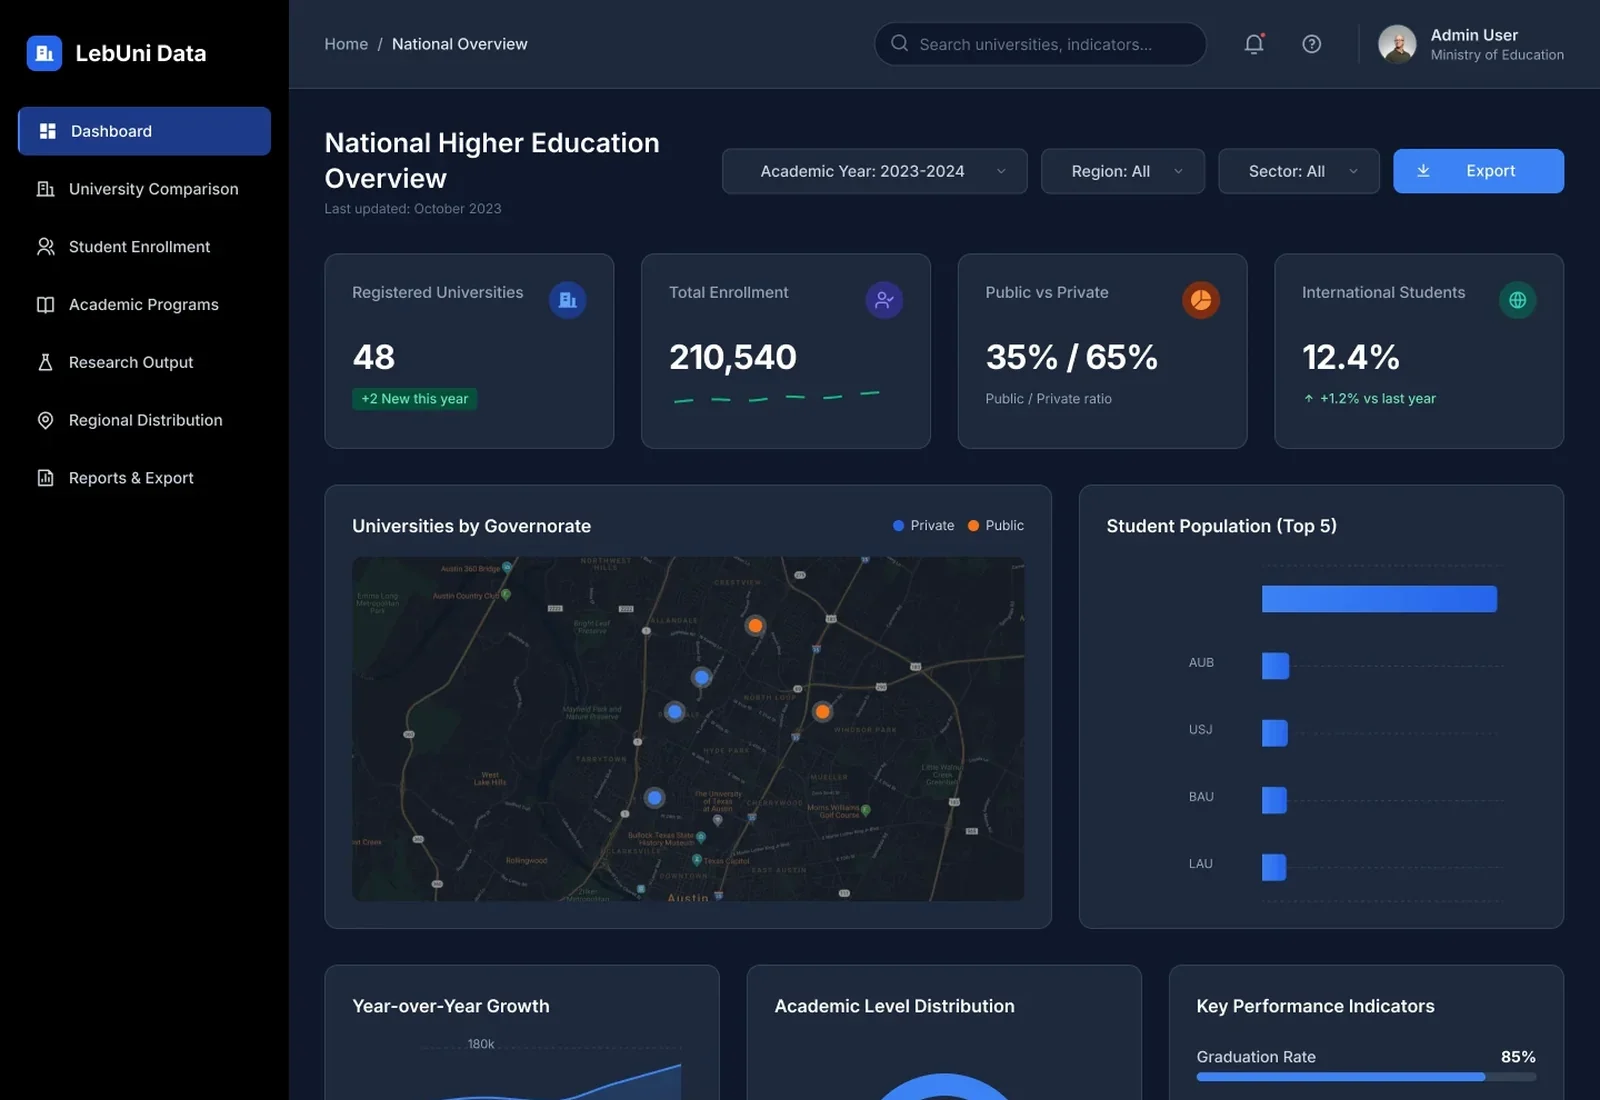
One anatomy, seven pages
Every page repeats the same structure, so learning one page teaches them all.
Right chart for the question
Ranked bars for comparison, vertical bars for trends, a donut only for parts of a whole, a map for place.
Honest numbers
Every page ends with the academic year and source, and totals match across pages.
10Usability testing & iterations
Task success, first round vs. after changes
Illustrative resultsTask-based walkthroughs of the prototype with analysts. Numbers below show how a test round would be reported.
Find total enrollment for 2023–2024
Before75%After98%Compare students per faculty for three universities
Before45%After90%Export the enrollment table
Before60%After95%
What we saw
Comparisons by total enrollment favoured large universities.
What changed
Added ratio indicators (students per faculty) and a plain-language insights panel.
Why
A fair comparison needs size-independent measures.
What we saw
People looked for the export in different places on each page.
What changed
One primary export button, always at the top right of the page header.
Why
Consistent placement removes searching.
What we saw
Chart colours changed meaning between pages.
What changed
Fixed a colour per series (e.g. orange is always public institutions) across the product.
Why
Consistent colour lets people read charts without the legend.
11Final outcomes
LebUni Data turns a scattered national dataset into seven clear pages that answer the questions analysts are actually asked, with the exact figures and sources behind every chart.
7
pages, one per key question about the sector
1
shared page anatomy: title, filters, KPIs, chart, table
2
themes designed together from one token set
Key takeaways
- Organising a dashboard around questions beats organising it around datasets.
- Every chart needs the table beneath it for people who quote numbers.
- Fixed series colours are a quiet but powerful consistency tool.
What I would do next
- Validate the information architecture with a tree test.
- Add saved views and scheduled report exports.
- Design the Arabic (right-to-left) version.